OPEN-SOURCE SCRIPT
업데이트됨 Trend Structure Shift By BCB Elevate
Trend Structure Shift by BCB Elevate
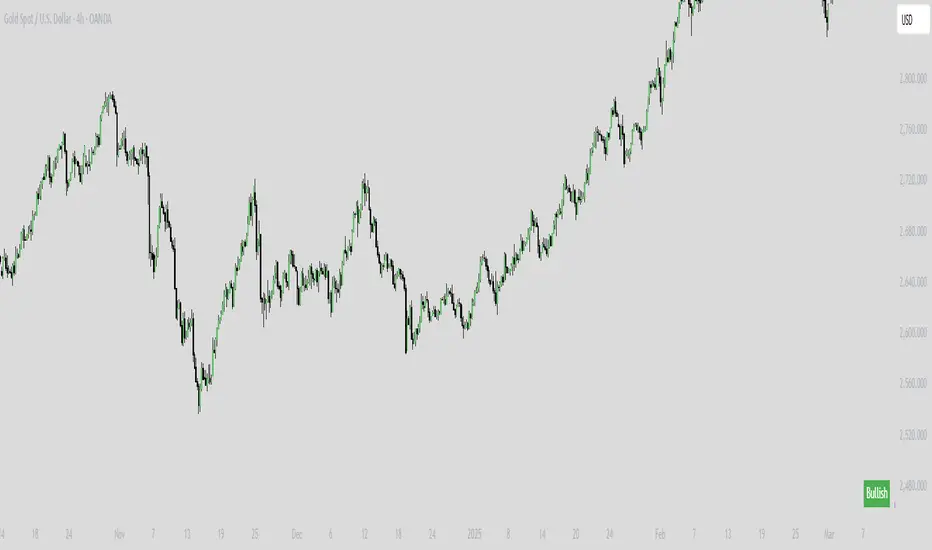
This indicator helps traders identify trend structure shifts by detecting Higher Highs (HH) and Lower Lows (LL) to determine bullish, bearish, or neutral market conditions. It provides real-time trend classification to help traders align with market direction.
How It Works:
📌 Bullish Trend: A new Higher High (HH) is detected, signaling potential uptrend continuation.
📌 Bearish Trend: A new Lower Low (LL) is detected, indicating potential downtrend continuation.
📌 Neutral: No significant trend shift is detected.
Key Features:
✅ Dynamic Trend Detection – Identifies key trend structure shifts using swing highs and lows.
✅ Customizable Settings – Adjust the swing length to fine-tune trend detection.
✅ Trend Table Display – Shows current trend as Bullish, Bearish, or Neutral in a convenient on-chart table.
✅ Table Position Selection – Choose where the trend table appears on the chart (Top/Bottom Left or Right).
✅ Works on All Markets & Timeframes – Use it for Crypto, Forex, Stocks, Commodities, and Indices.
How to Use:
1️⃣ Apply the indicator to your chart.
2️⃣ Observe the Trend Table to determine the market condition.
3️⃣ Use it with support/resistance, moving averages, or other indicators for better trade decisions.
릴리즈 노트
minor fixes오픈 소스 스크립트
트레이딩뷰의 진정한 정신에 따라, 이 스크립트의 작성자는 이를 오픈소스로 공개하여 트레이더들이 기능을 검토하고 검증할 수 있도록 했습니다. 작성자에게 찬사를 보냅니다! 이 코드는 무료로 사용할 수 있지만, 코드를 재게시하는 경우 하우스 룰이 적용된다는 점을 기억하세요.
면책사항
해당 정보와 게시물은 금융, 투자, 트레이딩 또는 기타 유형의 조언이나 권장 사항으로 간주되지 않으며, 트레이딩뷰에서 제공하거나 보증하는 것이 아닙니다. 자세한 내용은 이용 약관을 참조하세요.
오픈 소스 스크립트
트레이딩뷰의 진정한 정신에 따라, 이 스크립트의 작성자는 이를 오픈소스로 공개하여 트레이더들이 기능을 검토하고 검증할 수 있도록 했습니다. 작성자에게 찬사를 보냅니다! 이 코드는 무료로 사용할 수 있지만, 코드를 재게시하는 경우 하우스 룰이 적용된다는 점을 기억하세요.
면책사항
해당 정보와 게시물은 금융, 투자, 트레이딩 또는 기타 유형의 조언이나 권장 사항으로 간주되지 않으며, 트레이딩뷰에서 제공하거나 보증하는 것이 아닙니다. 자세한 내용은 이용 약관을 참조하세요.