OPEN-SOURCE SCRIPT
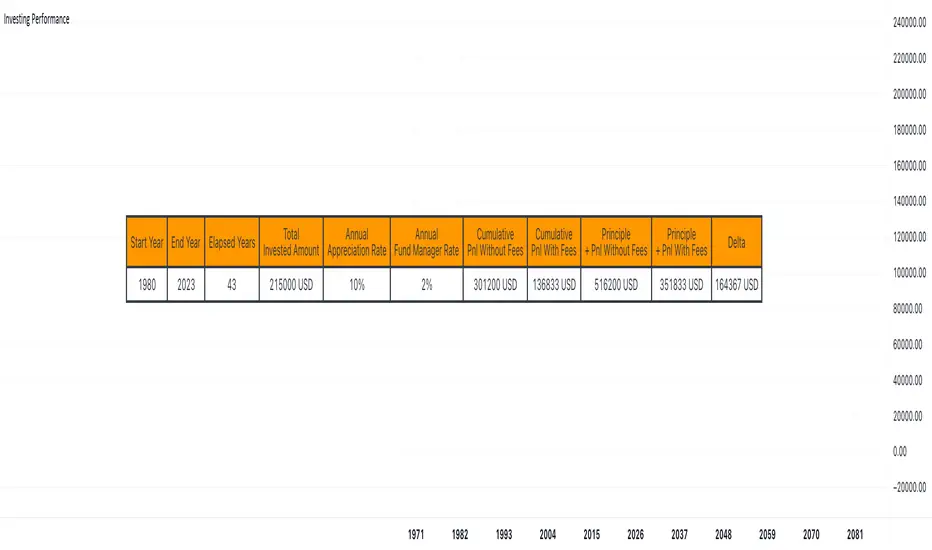
Investing Performance with vs without fees
Hello traders,
I had a chat with a friend recently who's using a fund manager services to invest for him in some US-based ETFs tracking the US indices.
I showed him using an online tool that those 2% annual fees he's paying to his fund manager are eating a lot of his profit overtime.
As I had some time, I decided to code this simulator in Pinescript because .... why not :)
RicardoSantos already did that Compound Interest function (tradingview.com/script/woq6TTda-FunctionCompoundInterest/)
I added the n parameter being the number of times the interest is compounded per unit of time
Compound interest is calculated using the following formula
CI = P*(1 + R/n) (n*t) – P
Here,
For now, the script only works on a yearly chart - I might update it later making it compatible with other chart timeframes - assuming there is some demand for it
If there is, let me know in the comments down below
All the best
Dave
I had a chat with a friend recently who's using a fund manager services to invest for him in some US-based ETFs tracking the US indices.
I showed him using an online tool that those 2% annual fees he's paying to his fund manager are eating a lot of his profit overtime.
As I had some time, I decided to code this simulator in Pinescript because .... why not :)
RicardoSantos already did that Compound Interest function (tradingview.com/script/woq6TTda-FunctionCompoundInterest/)
I added the n parameter being the number of times the interest is compounded per unit of time
Compound interest is calculated using the following formula
CI = P*(1 + R/n) (n*t) – P
Here,
- P is the principal amount.
- R is the annual interest rate.
- t is the time the money is invested or borrowed for.
- n is the number of times that interest is compounded per unit t, for example if interest is compounded monthly and t is in years then the value of n would be 12.
If interest is compounded quarterly and t is in years then the value of n would be 4.
For now, the script only works on a yearly chart - I might update it later making it compatible with other chart timeframes - assuming there is some demand for it
If there is, let me know in the comments down below
All the best
Dave
오픈 소스 스크립트
트레이딩뷰의 진정한 정신에 따라, 이 스크립트의 작성자는 이를 오픈소스로 공개하여 트레이더들이 기능을 검토하고 검증할 수 있도록 했습니다. 작성자에게 찬사를 보냅니다! 이 코드는 무료로 사용할 수 있지만, 코드를 재게시하는 경우 하우스 룰이 적용된다는 점을 기억하세요.
⭐️ I'm looking to sell Best Trading Indicator. DM me if interested
⭐️ Listed as an Official TradingView Trusted TOP Pine Programmer
📧 Coding/Consulting Inquiries: dave@best-trading-indicator.com
⏩ Course: best-trading-indicator.com
⭐️ Listed as an Official TradingView Trusted TOP Pine Programmer
📧 Coding/Consulting Inquiries: dave@best-trading-indicator.com
⏩ Course: best-trading-indicator.com
면책사항
해당 정보와 게시물은 금융, 투자, 트레이딩 또는 기타 유형의 조언이나 권장 사항으로 간주되지 않으며, 트레이딩뷰에서 제공하거나 보증하는 것이 아닙니다. 자세한 내용은 이용 약관을 참조하세요.