OPEN-SOURCE SCRIPT
Buy/Sell Volume Balance
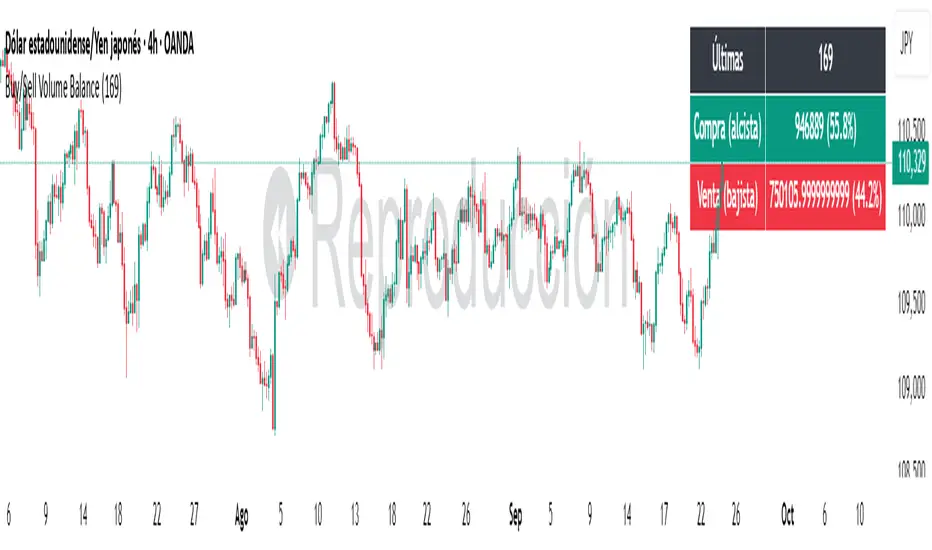
DESCRIPTION
Buy/Sell Volume Balance is a simple yet powerful indicator designed to measure and visualize the balance between buying and selling volume over a customizable number of recent candles. It helps traders quickly assess market pressure during consolidation phases or ranges, in order to anticipate the most likely breakout direction.
How it works
The indicator analyzes the last N candles (default = 100, user-editable).
Each candle’s total volume is classified as:
Bullish volume (Buy volume): if the candle closes above or equal to its open.
Bearish volume (Sell volume): if the candle closes below its open.
The volumes are summed separately to calculate:
Total Buy Volume
Total Sell Volume
The percentage of each side relative to the total is also displayed.
All results are shown in a fixed table at the top of the chart for quick interpretation.
Purpose
This tool is specifically designed to help traders evaluate the internal battle between buyers and sellers during a range or sideways market. By understanding which side is accumulating more volume within the range, traders can anticipate which direction is more likely when the price breaks out.
If Buy volume dominates → potential bullish breakout.
If Sell volume dominates → potential bearish breakout.
If both sides are nearly balanced, it signals indecision and a higher chance of false breakouts.
Imbalance Threshold
In practice, traders often consider a clear imbalance when one side reaches at least 55–60% of the total volume.
Above this threshold, the dominant side is more likely to dictate the breakout direction.
Below this threshold, the market is usually in indecision and further confirmation is needed before acting.
How to use it
Add the indicator to your chart and choose the lookback period (number of candles).
Focus on ranges or consolidation zones where price is moving sideways.
Observe the balance of Buy vs Sell volume in the top-right box:
A clear imbalance (>55–60%) suggests the stronger side is more likely to push the breakout.
A balanced ratio (<55–60%) indicates indecision and possible false breakouts.
Use it in combination with support/resistance zones, breakout patterns, or volume spikes for best results.
✅ In summary: This indicator does not give direct buy/sell signals, but it provides valuable context about market pressure, helping you to align your trades with the most probable breakout direction.
오픈 소스 스크립트
트레이딩뷰의 진정한 정신에 따라, 이 스크립트의 작성자는 이를 오픈소스로 공개하여 트레이더들이 기능을 검토하고 검증할 수 있도록 했습니다. 작성자에게 찬사를 보냅니다! 이 코드는 무료로 사용할 수 있지만, 코드를 재게시하는 경우 하우스 룰이 적용된다는 점을 기억하세요.
면책사항
해당 정보와 게시물은 금융, 투자, 트레이딩 또는 기타 유형의 조언이나 권장 사항으로 간주되지 않으며, 트레이딩뷰에서 제공하거나 보증하는 것이 아닙니다. 자세한 내용은 이용 약관을 참조하세요.
오픈 소스 스크립트
트레이딩뷰의 진정한 정신에 따라, 이 스크립트의 작성자는 이를 오픈소스로 공개하여 트레이더들이 기능을 검토하고 검증할 수 있도록 했습니다. 작성자에게 찬사를 보냅니다! 이 코드는 무료로 사용할 수 있지만, 코드를 재게시하는 경우 하우스 룰이 적용된다는 점을 기억하세요.
면책사항
해당 정보와 게시물은 금융, 투자, 트레이딩 또는 기타 유형의 조언이나 권장 사항으로 간주되지 않으며, 트레이딩뷰에서 제공하거나 보증하는 것이 아닙니다. 자세한 내용은 이용 약관을 참조하세요.