OPEN-SOURCE SCRIPT
Bullish Gap Up Detection
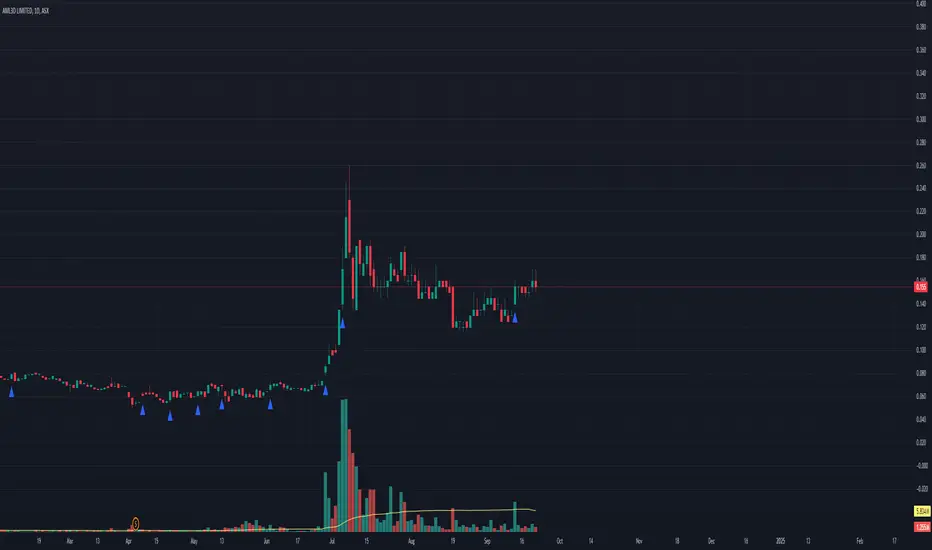
This indicator is designed to identify gap-up trading opportunities in real-time. A gap-up occurs when the opening price of a stock is higher than the previous day's high, signaling potential bullish momentum.
Key Features:
Gap Detection: The indicator detects when today’s open is above yesterday’s high and remains above that level throughout the trading session.
Visual Alerts: A triangle shape appears below the price bar when a gap-up condition is met, providing clear visual signals for traders to consider potential entry points.
EMA Analysis: The indicator incorporates two Exponential Moving Averages:
10-day EMA: Used to assess short-term price trends and help determine if the stock is currently in an upward momentum phase.
20-day EMA: Provides additional context for medium-term trends, ensuring that gaps are only considered when the stock is in a favorable trend.
The indicator confirms that the 10-day EMA is above the 20-day EMA, indicating bullish sentiment in the market.
This indicator can be used in various trading strategies to capitalize on momentum following gap-up openings. It’s suitable for day traders and swing traders looking for entry points in trending stocks.
오픈 소스 스크립트
트레이딩뷰의 진정한 정신에 따라, 이 스크립트의 작성자는 이를 오픈소스로 공개하여 트레이더들이 기능을 검토하고 검증할 수 있도록 했습니다. 작성자에게 찬사를 보냅니다! 이 코드는 무료로 사용할 수 있지만, 코드를 재게시하는 경우 하우스 룰이 적용된다는 점을 기억하세요.
면책사항
해당 정보와 게시물은 금융, 투자, 트레이딩 또는 기타 유형의 조언이나 권장 사항으로 간주되지 않으며, 트레이딩뷰에서 제공하거나 보증하는 것이 아닙니다. 자세한 내용은 이용 약관을 참조하세요.
오픈 소스 스크립트
트레이딩뷰의 진정한 정신에 따라, 이 스크립트의 작성자는 이를 오픈소스로 공개하여 트레이더들이 기능을 검토하고 검증할 수 있도록 했습니다. 작성자에게 찬사를 보냅니다! 이 코드는 무료로 사용할 수 있지만, 코드를 재게시하는 경우 하우스 룰이 적용된다는 점을 기억하세요.
면책사항
해당 정보와 게시물은 금융, 투자, 트레이딩 또는 기타 유형의 조언이나 권장 사항으로 간주되지 않으며, 트레이딩뷰에서 제공하거나 보증하는 것이 아닙니다. 자세한 내용은 이용 약관을 참조하세요.