PROTECTED SOURCE SCRIPT
업데이트됨 Volume Delta Histogram and Bands
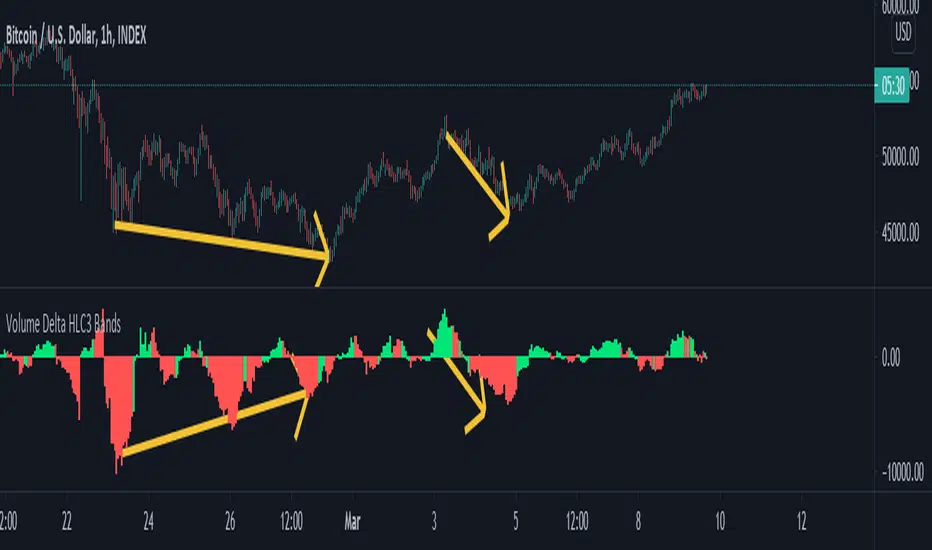
This study takes the lower timeframe volume from the specified "Volume Data Time Period", and calculates the sum of volume over the user specified "Volume Signal period", doing its best to take an approximation of delta.
This is displayed via a histogram, and can be used to trade divergences, see trends strengthen and weaken as illustrated on the chart below.

You can also display reversal areas, which will show when the "Volume Signal Period" exceeds one half of the average volume plus two standard deviations over the "Volume Comparison Period."
Think of this like bollinger bands for volume trends, when the bands are tight crossing outside them can signal strength, but when they are moderate or contracting it can show an area for a likely reversal.
This is displayed via a histogram, and can be used to trade divergences, see trends strengthen and weaken as illustrated on the chart below.
You can also display reversal areas, which will show when the "Volume Signal Period" exceeds one half of the average volume plus two standard deviations over the "Volume Comparison Period."
Think of this like bollinger bands for volume trends, when the bands are tight crossing outside them can signal strength, but when they are moderate or contracting it can show an area for a likely reversal.
릴리즈 노트
Fixed calculations and removed reversals, they didnt do much anyways.Histogram shows the volume over the comparison period, color of histogram is determined by delta volume over the signal period.
보호된 스크립트입니다
이 스크립트는 비공개 소스로 게시됩니다. 하지만 이를 자유롭게 제한 없이 사용할 수 있습니다 – 자세한 내용은 여기에서 확인하세요.
면책사항
해당 정보와 게시물은 금융, 투자, 트레이딩 또는 기타 유형의 조언이나 권장 사항으로 간주되지 않으며, 트레이딩뷰에서 제공하거나 보증하는 것이 아닙니다. 자세한 내용은 이용 약관을 참조하세요.
보호된 스크립트입니다
이 스크립트는 비공개 소스로 게시됩니다. 하지만 이를 자유롭게 제한 없이 사용할 수 있습니다 – 자세한 내용은 여기에서 확인하세요.
면책사항
해당 정보와 게시물은 금융, 투자, 트레이딩 또는 기타 유형의 조언이나 권장 사항으로 간주되지 않으며, 트레이딩뷰에서 제공하거나 보증하는 것이 아닙니다. 자세한 내용은 이용 약관을 참조하세요.