PROTECTED SOURCE SCRIPT
업데이트됨 Mind the GAP! (Automatic Intraday GAP Overnight) | by Octopu$
🤏 Mind the GAP! (Automatic Intraday GAP Overnight) | by Octopu$
Gaps are areas on a chart where the price of a stock moves sharply up or down, with little or no trading in between.
When it happens overnight (not considering Extended Hours), it is just considered as Price Level, for possible revisit.
A Gap is defined when the Open current Candle is Higher or Lower than the Close of the Last Candle:
When the Open of the current Candle is Higher than the Close of the Last Candle it is considered a Gap UP;
When the Open of the current Candle is Lower than the Close of the Last Candle it is considered a Gap DOWN;
Something interesting about Gap is that:
1. The Price Action can travel fast between these levels (Volatility);
2. One (or both) of these levels (Hi/Lo) can act as Support (or Breakout);
3. One (or both) of these levels (Hi/Lo) can act as Resistance (or Breakout).
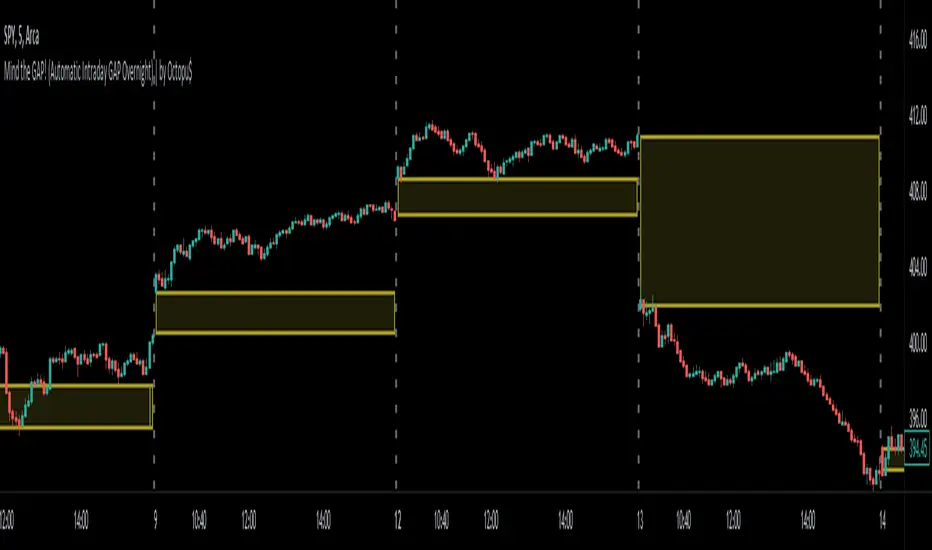
This Indicator includes these Gaps added Automatically to your Chart.
It is also built-in with a Shadow between the lines for easy visualization.
Colors are also customizable and the Lines are also editable according t your preferences.
Any Time Frame. Any Ticker.
(Using SPY 5m just as an example:)
tradingview.com/chart/Nk9RhGET/
 SPY
SPY
Features:
• Identifies Gaps on MC/MO
• Automatically adds Lines to these levels
• Includes shadow for easy visualization
Options:
• Customizable: Colors and Lines
• On/Off Switches for the Levels
• Show/Hide Previous Days
Notes:
v1.0
Indicator release
Changes and updates can come in the future for additional functionalities or per requests.
Did you like it? Boost it. Shoot a message! I'd appreciate if you dropped by to say thanks.
- Octopu$
🐙
Gaps are areas on a chart where the price of a stock moves sharply up or down, with little or no trading in between.
When it happens overnight (not considering Extended Hours), it is just considered as Price Level, for possible revisit.
A Gap is defined when the Open current Candle is Higher or Lower than the Close of the Last Candle:
When the Open of the current Candle is Higher than the Close of the Last Candle it is considered a Gap UP;
When the Open of the current Candle is Lower than the Close of the Last Candle it is considered a Gap DOWN;
Something interesting about Gap is that:
1. The Price Action can travel fast between these levels (Volatility);
2. One (or both) of these levels (Hi/Lo) can act as Support (or Breakout);
3. One (or both) of these levels (Hi/Lo) can act as Resistance (or Breakout).
This Indicator includes these Gaps added Automatically to your Chart.
It is also built-in with a Shadow between the lines for easy visualization.
Colors are also customizable and the Lines are also editable according t your preferences.
Any Time Frame. Any Ticker.
(Using SPY 5m just as an example:)
tradingview.com/chart/Nk9RhGET/
Features:
• Identifies Gaps on MC/MO
• Automatically adds Lines to these levels
• Includes shadow for easy visualization
Options:
• Customizable: Colors and Lines
• On/Off Switches for the Levels
• Show/Hide Previous Days
Notes:
v1.0
Indicator release
Changes and updates can come in the future for additional functionalities or per requests.
Did you like it? Boost it. Shoot a message! I'd appreciate if you dropped by to say thanks.
- Octopu$
🐙
릴리즈 노트
Updates릴리즈 노트
First update+Positioning
Clean code
릴리즈 노트
v5 Update릴리즈 노트
Coloring보호된 스크립트입니다
이 스크립트는 비공개 소스로 게시됩니다. 하지만 이를 자유롭게 제한 없이 사용할 수 있습니다 – 자세한 내용은 여기에서 확인하세요.
🐙 Join me: bit.ly/JoinOctopuS
💰 Donate: bit.ly/ThankYouOctopuS
🐦 Twitter: twitter.com/OctopuSSSign
💰 Donate: bit.ly/ThankYouOctopuS
🐦 Twitter: twitter.com/OctopuSSSign
면책사항
해당 정보와 게시물은 금융, 투자, 트레이딩 또는 기타 유형의 조언이나 권장 사항으로 간주되지 않으며, 트레이딩뷰에서 제공하거나 보증하는 것이 아닙니다. 자세한 내용은 이용 약관을 참조하세요.
보호된 스크립트입니다
이 스크립트는 비공개 소스로 게시됩니다. 하지만 이를 자유롭게 제한 없이 사용할 수 있습니다 – 자세한 내용은 여기에서 확인하세요.
🐙 Join me: bit.ly/JoinOctopuS
💰 Donate: bit.ly/ThankYouOctopuS
🐦 Twitter: twitter.com/OctopuSSSign
💰 Donate: bit.ly/ThankYouOctopuS
🐦 Twitter: twitter.com/OctopuSSSign
면책사항
해당 정보와 게시물은 금융, 투자, 트레이딩 또는 기타 유형의 조언이나 권장 사항으로 간주되지 않으며, 트레이딩뷰에서 제공하거나 보증하는 것이 아닙니다. 자세한 내용은 이용 약관을 참조하세요.