PROTECTED SOURCE SCRIPT
US Treasury Spot-Futures Price Differential
Basis Trade Analyzer: US Treasury Spot vs Futures Price Differential
Description:
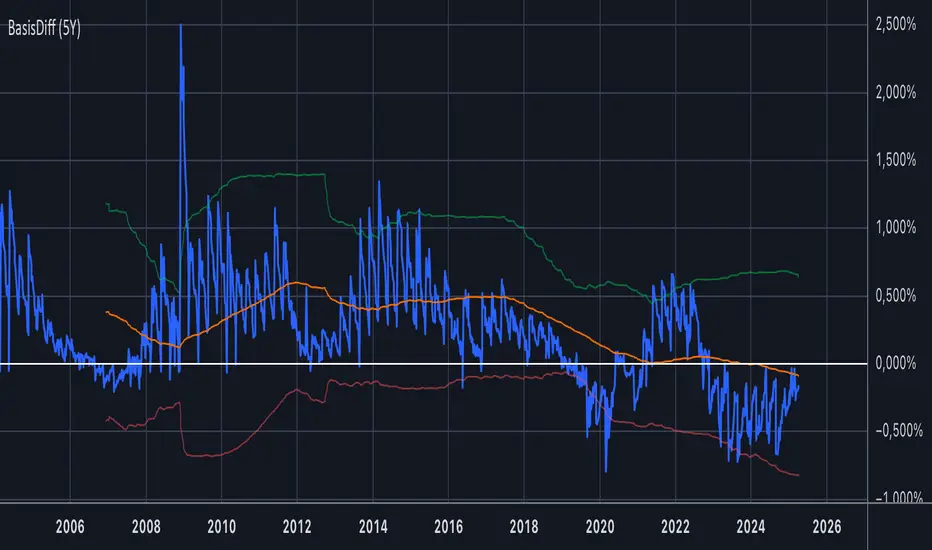
This advanced indicator calculates and visualizes the price difference between US Treasury notes/bonds in the spot market versus their corresponding futures contracts. It's designed for traders who specialize in basis trading and cash-and-carry arbitrage strategies.
Key Features:
Calculates real-time price differential (basis) between spot and futures for 2Y, 5Y, and 10Y Treasuries
Displays the basis in both price points and basis points (bps)
Visualizes 200-day moving average and ±2 standard deviation bands
Includes comprehensive data table with:
Current spot and futures prices
Price differential and historical average
Volatility measurements
Built-in alerts for statistically significant deviations
Supported Instruments:
Spot: USB02YUSD (2Y), USB05YUSD (5Y), USB10YUSD (10Y)
Futures: ZT1! (2Y), ZF1! (5Y), ZN1! (10Y)
Usage Instructions:
Select the Treasury maturity (2Y/5Y/10Y) from the input menu
Monitor the blue line for current basis
Watch for mean-reversion opportunities when price approaches the bands
Use the data table for quick reference to key metrics
Professional Applications:
Identify cash-and-carry arbitrage opportunities
Monitor convergence trends as contracts approach delivery
Analyze historical basis volatility patterns
Develop relative value trading strategies
Note: The indicator uses direct price comparisons (not yields) for accurate basis calculations. For optimal results, use daily or weekly timeframes.
Description:
This advanced indicator calculates and visualizes the price difference between US Treasury notes/bonds in the spot market versus their corresponding futures contracts. It's designed for traders who specialize in basis trading and cash-and-carry arbitrage strategies.
Key Features:
Calculates real-time price differential (basis) between spot and futures for 2Y, 5Y, and 10Y Treasuries
Displays the basis in both price points and basis points (bps)
Visualizes 200-day moving average and ±2 standard deviation bands
Includes comprehensive data table with:
Current spot and futures prices
Price differential and historical average
Volatility measurements
Built-in alerts for statistically significant deviations
Supported Instruments:
Spot: USB02YUSD (2Y), USB05YUSD (5Y), USB10YUSD (10Y)
Futures: ZT1! (2Y), ZF1! (5Y), ZN1! (10Y)
Usage Instructions:
Select the Treasury maturity (2Y/5Y/10Y) from the input menu
Monitor the blue line for current basis
Watch for mean-reversion opportunities when price approaches the bands
Use the data table for quick reference to key metrics
Professional Applications:
Identify cash-and-carry arbitrage opportunities
Monitor convergence trends as contracts approach delivery
Analyze historical basis volatility patterns
Develop relative value trading strategies
Note: The indicator uses direct price comparisons (not yields) for accurate basis calculations. For optimal results, use daily or weekly timeframes.
보호된 스크립트입니다
이 스크립트는 비공개 소스로 게시됩니다. 하지만 이를 자유롭게 제한 없이 사용할 수 있습니다 – 자세한 내용은 여기에서 확인하세요.
면책사항
해당 정보와 게시물은 금융, 투자, 트레이딩 또는 기타 유형의 조언이나 권장 사항으로 간주되지 않으며, 트레이딩뷰에서 제공하거나 보증하는 것이 아닙니다. 자세한 내용은 이용 약관을 참조하세요.
보호된 스크립트입니다
이 스크립트는 비공개 소스로 게시됩니다. 하지만 이를 자유롭게 제한 없이 사용할 수 있습니다 – 자세한 내용은 여기에서 확인하세요.
면책사항
해당 정보와 게시물은 금융, 투자, 트레이딩 또는 기타 유형의 조언이나 권장 사항으로 간주되지 않으며, 트레이딩뷰에서 제공하거나 보증하는 것이 아닙니다. 자세한 내용은 이용 약관을 참조하세요.