INVITE-ONLY SCRIPT
업데이트됨 3D WAVE-PM (3x Res Log 625-2000) [acatwithcharts]
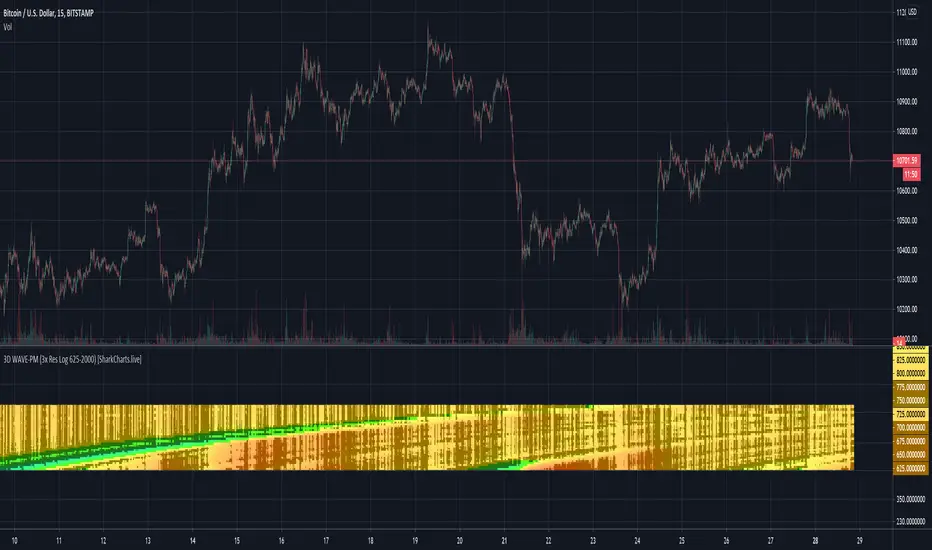
This is an (il)logical extreme adaptation of my (il)logical extreme adaption of Mark Whistler's WAVE-PM script, originally published in his book Volatility Illuminated as a MetaTrader script.
In 3D WAVE-PM, I plotted 32 period lengths from 14 to 600 at height equal to their length, reading out colors based on their value. I chose those lengths to create a relatively continuous indicator on log scale.
What I really wanted to do though was to (1) have the option to view this indicator in either linear or log and (2) not lose as much data resolution across nearly 600 periods. Within the limitations of Pinescript, the best solution I could find was to make multiple indicators hard-coding the different period lengths to create linear and log ranges such that I could make a composite heatmap with several different indicators on the same pane.
...but then I went a step further on the log scale version, noticing that I could easily make a 4th indicator that covers the 625-2000 period region at similar resolution to the other 3. So I did. This is therefore the "4th of 3 indicators" for log scale 3x resolution WAVE-PM.
It adds significant lag on top of what was already caused by 3x WAVE-PM, but I have found it broadly useful enough when looking at large expansions that I'm going to go ahead and launch it. I strongly recommend doing any other analysis in a separate tab from the one in which you have high-res 3D indicators open.
I'm excited to announce that we're putting the finishing touches on a subscription service for the volatility theory indicators, and assuming no hiccups will launch them within days. Subscriptions will be available in several packages through SharkCharts.live
Current pricing and subscription details will be kept up-to-date on SharkCharts.live
릴리즈 노트
Minor update to v4.릴리즈 노트
I'm making a round of updates to my scripts after testing some of the new Pinescript features and looking for ways to address loading issues that have arisen from changes over the past 6 months or so as to what thresholds cause scripts to fail on the back end. 초대 전용 스크립트
이 스크립트는 작성자가 승인한 사용자만 접근할 수 있습니다. 사용하려면 요청 후 승인을 받아야 하며, 일반적으로 결제 후에 허가가 부여됩니다. 자세한 내용은 아래 작성자의 안내를 따르거나 acatwithcharts에게 직접 문의하세요.
트레이딩뷰는 스크립트의 작동 방식을 충분히 이해하고 작성자를 완전히 신뢰하지 않는 이상, 해당 스크립트에 비용을 지불하거나 사용하는 것을 권장하지 않습니다. 커뮤니티 스크립트에서 무료 오픈소스 대안을 찾아보실 수도 있습니다.
작성자 지시 사항
My volatility-based indicators are available for sale at SharkCharts.live
Feel free to reach out to me with any questions; more information is available on the SharkCharts website and the SharkCharts discord discord.gg/YVpTeSK
Feel free to reach out to me with any questions; more information is available on the SharkCharts website and the SharkCharts discord discord.gg/YVpTeSK
면책사항
해당 정보와 게시물은 금융, 투자, 트레이딩 또는 기타 유형의 조언이나 권장 사항으로 간주되지 않으며, 트레이딩뷰에서 제공하거나 보증하는 것이 아닙니다. 자세한 내용은 이용 약관을 참조하세요.
초대 전용 스크립트
이 스크립트는 작성자가 승인한 사용자만 접근할 수 있습니다. 사용하려면 요청 후 승인을 받아야 하며, 일반적으로 결제 후에 허가가 부여됩니다. 자세한 내용은 아래 작성자의 안내를 따르거나 acatwithcharts에게 직접 문의하세요.
트레이딩뷰는 스크립트의 작동 방식을 충분히 이해하고 작성자를 완전히 신뢰하지 않는 이상, 해당 스크립트에 비용을 지불하거나 사용하는 것을 권장하지 않습니다. 커뮤니티 스크립트에서 무료 오픈소스 대안을 찾아보실 수도 있습니다.
작성자 지시 사항
My volatility-based indicators are available for sale at SharkCharts.live
Feel free to reach out to me with any questions; more information is available on the SharkCharts website and the SharkCharts discord discord.gg/YVpTeSK
Feel free to reach out to me with any questions; more information is available on the SharkCharts website and the SharkCharts discord discord.gg/YVpTeSK
면책사항
해당 정보와 게시물은 금융, 투자, 트레이딩 또는 기타 유형의 조언이나 권장 사항으로 간주되지 않으며, 트레이딩뷰에서 제공하거나 보증하는 것이 아닙니다. 자세한 내용은 이용 약관을 참조하세요.