PROTECTED SOURCE SCRIPT
Optimal Retracement
📘 Optimal Retracement
Fibonacci Retracement Confluence Indicator
(Protected Source)
🧭 Overview
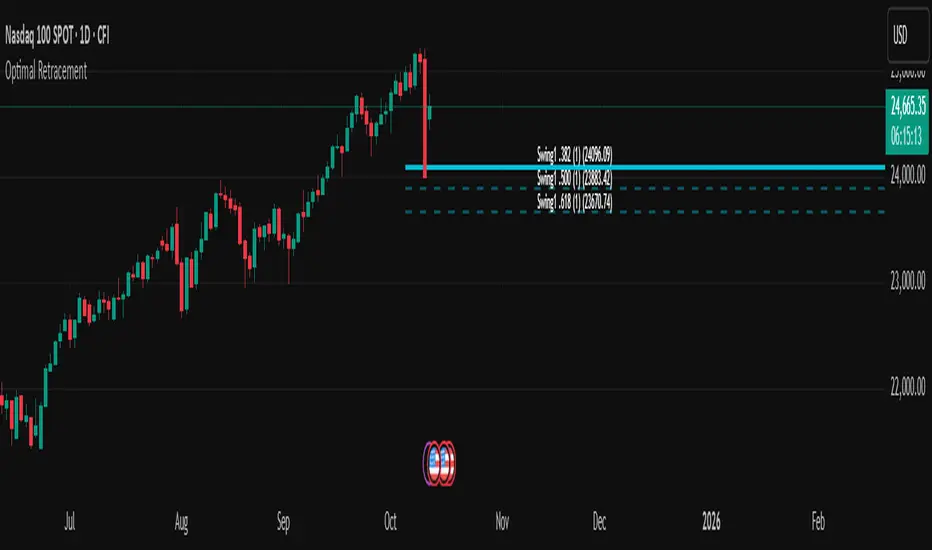
Optimal Retracement is a clean, professional Fibonacci retracement engine that finds price cluster zones where multiple retracements from recent swings align within a tight range. It mirrors the minimalist style of your projection tool: single horizontal lines, right-edge labels with ratio and price, optional price-scale markers, and a clustering core that designates one Prime retracement level with spaced Secondary levels.
⚙️ Core Features
Automatic Trend Bias
Select Auto (EMA-based), Up, or Down to focus calculations on the relevant swing direction.
Swing-Based Anchoring (Non-Repainting)
Builds swing legs from confirmed pivots (left/right bars), scanning a user-defined number of recent swings before computing retracement sets.
Fibonacci Retracements (Boroden)
Standard ratios: 0.236, 0.382, 0.500, 0.618, 0.786
• Up bias (Low→High): computes pullback support below the high.
• Down bias (High→Low): computes pullback resistance above the low.
Cluster Engine (Confluence Finder)
Groups nearby retracement levels within a tick-based tolerance, selects the highest-overlap Prime Cluster, and filters Secondary targets using a minimum spacing rule—keeping charts crisp and readable.
Smart Visualization
• One line per level, extending right a fixed length (configurable).
• Compact right-edge labels (ratio + exact price).
• Optional price-scale markers (Prime + up to two Secondaries).
• Distinct colors/widths for Prime vs Secondary levels.
Alerts Built-In
• Near Prime Cluster — when price approaches the Prime zone.
• Crossed Prime Cluster — when price breaks through the Prime zone.
(Optional runtime alerts include symbol, timeframe, and price.)
🎯 How to Use
Timeframe: Works on any TF; many prefer 1H–Daily for structure.
Bias: Set Auto, Up, or Down to align with trend context.
Swings: Tune Pivot Left/Right and Swings to Scan (e.g., 5–8).
Ratios: Toggle which retracement ratios to include.
Clustering: Adjust Cluster Tolerance (ticks), Min Members, and Min Spacing to instrument volatility/tick size.
Read: Use the Prime retracement cluster as your decision zone; Secondaries offer alternates if Prime is invalidated.
Alerts: Enable Near / Cross alerts to automate monitoring.
💡 Why It’s Different
Basic fib tools draw static lines from one swing. Optimal Retracement aggregates retracements across multiple recent swings and performs mathematical clustering to isolate the most overlapped zone. You get fewer lines, higher informational density, and an objective Prime level—a clean pullback map that pairs perfectly with projection/extension tools.
🔐 Protected Source Notice
Published as a Protected Script to preserve proprietary clustering, swing selection, and visualization design. All calculations, alerts, and visuals are fully functional while the core logic remains secured, consistent with TradingView’s standards for unique, non-trivial scripts.
⚠️ Disclaimer
For educational and analytical purposes only. This tool does not constitute financial advice or performance guarantees. Always perform independent analysis and manage risk appropriately.
🏷 Credits
Methodology inspired by Carolyn Boroden’s Fibonacci work (retracements & price clusters), adapted into a modern, cluster-driven retracement workflow with a minimal chart footprint.
Fibonacci Retracement Confluence Indicator
(Protected Source)
🧭 Overview
Optimal Retracement is a clean, professional Fibonacci retracement engine that finds price cluster zones where multiple retracements from recent swings align within a tight range. It mirrors the minimalist style of your projection tool: single horizontal lines, right-edge labels with ratio and price, optional price-scale markers, and a clustering core that designates one Prime retracement level with spaced Secondary levels.
⚙️ Core Features
Automatic Trend Bias
Select Auto (EMA-based), Up, or Down to focus calculations on the relevant swing direction.
Swing-Based Anchoring (Non-Repainting)
Builds swing legs from confirmed pivots (left/right bars), scanning a user-defined number of recent swings before computing retracement sets.
Fibonacci Retracements (Boroden)
Standard ratios: 0.236, 0.382, 0.500, 0.618, 0.786
• Up bias (Low→High): computes pullback support below the high.
• Down bias (High→Low): computes pullback resistance above the low.
Cluster Engine (Confluence Finder)
Groups nearby retracement levels within a tick-based tolerance, selects the highest-overlap Prime Cluster, and filters Secondary targets using a minimum spacing rule—keeping charts crisp and readable.
Smart Visualization
• One line per level, extending right a fixed length (configurable).
• Compact right-edge labels (ratio + exact price).
• Optional price-scale markers (Prime + up to two Secondaries).
• Distinct colors/widths for Prime vs Secondary levels.
Alerts Built-In
• Near Prime Cluster — when price approaches the Prime zone.
• Crossed Prime Cluster — when price breaks through the Prime zone.
(Optional runtime alerts include symbol, timeframe, and price.)
🎯 How to Use
Timeframe: Works on any TF; many prefer 1H–Daily for structure.
Bias: Set Auto, Up, or Down to align with trend context.
Swings: Tune Pivot Left/Right and Swings to Scan (e.g., 5–8).
Ratios: Toggle which retracement ratios to include.
Clustering: Adjust Cluster Tolerance (ticks), Min Members, and Min Spacing to instrument volatility/tick size.
Read: Use the Prime retracement cluster as your decision zone; Secondaries offer alternates if Prime is invalidated.
Alerts: Enable Near / Cross alerts to automate monitoring.
💡 Why It’s Different
Basic fib tools draw static lines from one swing. Optimal Retracement aggregates retracements across multiple recent swings and performs mathematical clustering to isolate the most overlapped zone. You get fewer lines, higher informational density, and an objective Prime level—a clean pullback map that pairs perfectly with projection/extension tools.
🔐 Protected Source Notice
Published as a Protected Script to preserve proprietary clustering, swing selection, and visualization design. All calculations, alerts, and visuals are fully functional while the core logic remains secured, consistent with TradingView’s standards for unique, non-trivial scripts.
⚠️ Disclaimer
For educational and analytical purposes only. This tool does not constitute financial advice or performance guarantees. Always perform independent analysis and manage risk appropriately.
🏷 Credits
Methodology inspired by Carolyn Boroden’s Fibonacci work (retracements & price clusters), adapted into a modern, cluster-driven retracement workflow with a minimal chart footprint.
보호된 스크립트입니다
이 스크립트는 비공개 소스로 게시됩니다. 하지만 이를 자유롭게 제한 없이 사용할 수 있습니다 – 자세한 내용은 여기에서 확인하세요.
Doer
면책사항
해당 정보와 게시물은 금융, 투자, 트레이딩 또는 기타 유형의 조언이나 권장 사항으로 간주되지 않으며, 트레이딩뷰에서 제공하거나 보증하는 것이 아닙니다. 자세한 내용은 이용 약관을 참조하세요.
보호된 스크립트입니다
이 스크립트는 비공개 소스로 게시됩니다. 하지만 이를 자유롭게 제한 없이 사용할 수 있습니다 – 자세한 내용은 여기에서 확인하세요.
면책사항
해당 정보와 게시물은 금융, 투자, 트레이딩 또는 기타 유형의 조언이나 권장 사항으로 간주되지 않으며, 트레이딩뷰에서 제공하거나 보증하는 것이 아닙니다. 자세한 내용은 이용 약관을 참조하세요.