OPEN-SOURCE SCRIPT
업데이트됨 Double Relative Strength Index (Double RSI)
# Double Relative Strength Index (Double RSI) Indicator
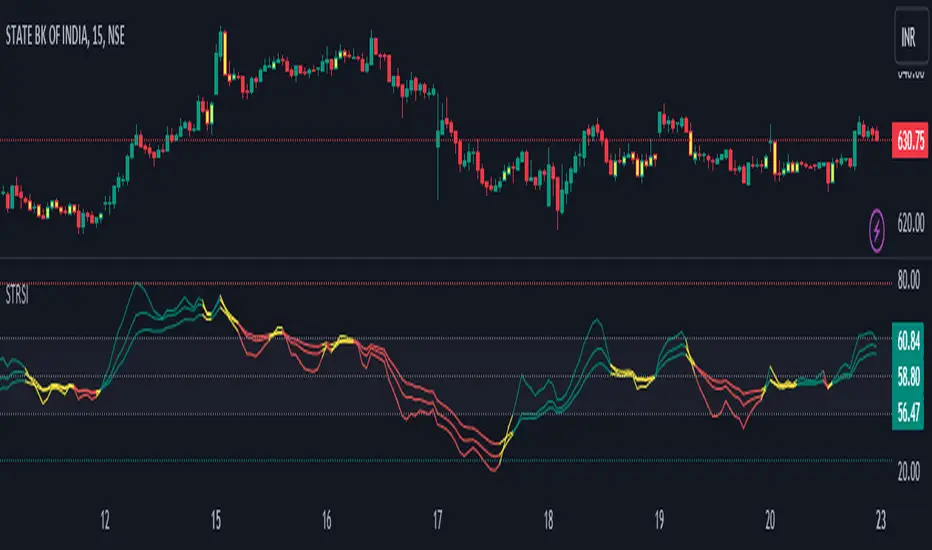
The Double Relative Strength Index (Double RSI) is a custom trading indicator for the TradingView platform. It provides traders with two Relative Strength Index (RSI) bands, a fast RSI, and a slow RSI, which can be helpful in identifying potential entry and exit points in the market.
## Features
- **Uses 2 RSI Bands:** The indicator displays two RSI lines on the chart, providing insights into the short-term and long-term strength of the asset's price movement.
- **Fast and Slow RSI:** The fast RSI uses a shorter length, while the slow RSI uses a longer length, allowing traders to observe different time frames of price momentum.
- **Smoothing:** To reduce noise and improve the readability of the RSI lines, the indicator offers multiple smoothing options such as RMA, SMA, EMA, WMA, and HMA.
- **Crossover and Crossunder Signals:** The indicator identifies potential trading signals when the fast RSI crosses above or below the slow RSI. These events are visually highlighted on the chart with color-coded candlesticks.
- **RSI Bands:** The indicator also includes colored bands that represent different RSI levels, such as 80%, 75%, 60%, 50%, 45%, 25%, and 20%. These bands help visualize the RSI's current position relative to overbought and oversold conditions.
## How to Use
1. Add the "Double RSI" indicator to your TradingView chart.
2. Customize the input parameters according to your preferences, such as the lengths of the fast and slow RSIs and the smoothing method.
3. The indicator will display two RSI lines on the chart, each with its own color.
4. Look for crossover events where the fast RSI line crosses above the slow RSI line, indicating a potential bullish signal.
5. Watch for crossunder events where the fast RSI line crosses below the slow RSI line, indicating a potential bearish signal.
6. The colored bands represent different RSI levels. When the RSI is in the overbought (high) or oversold (low) regions, it may suggest a potential reversal in price direction.
## Disclaimer
Please remember that the Double RSI indicator is provided for informational purposes only and should not be considered as financial advice or a standalone trading strategy. Always perform your own research, use additional tools and indicators, and consider risk management techniques before making any trading decisions.
**Note:** This code is subject to the terms of the Mozilla Public License 2.0. For more details, refer to the [Mozilla Public License 2.0](mozilla.org/MPL/2.0/).
릴리즈 노트
Updated on 21 January 2024- Double and Tripple Smoothed RSI.
- Switch between Versions.
- Color change.
오픈 소스 스크립트
트레이딩뷰의 진정한 정신에 따라, 이 스크립트의 작성자는 이를 오픈소스로 공개하여 트레이더들이 기능을 검토하고 검증할 수 있도록 했습니다. 작성자에게 찬사를 보냅니다! 이 코드는 무료로 사용할 수 있지만, 코드를 재게시하는 경우 하우스 룰이 적용된다는 점을 기억하세요.
면책사항
해당 정보와 게시물은 금융, 투자, 트레이딩 또는 기타 유형의 조언이나 권장 사항으로 간주되지 않으며, 트레이딩뷰에서 제공하거나 보증하는 것이 아닙니다. 자세한 내용은 이용 약관을 참조하세요.
오픈 소스 스크립트
트레이딩뷰의 진정한 정신에 따라, 이 스크립트의 작성자는 이를 오픈소스로 공개하여 트레이더들이 기능을 검토하고 검증할 수 있도록 했습니다. 작성자에게 찬사를 보냅니다! 이 코드는 무료로 사용할 수 있지만, 코드를 재게시하는 경우 하우스 룰이 적용된다는 점을 기억하세요.
면책사항
해당 정보와 게시물은 금융, 투자, 트레이딩 또는 기타 유형의 조언이나 권장 사항으로 간주되지 않으며, 트레이딩뷰에서 제공하거나 보증하는 것이 아닙니다. 자세한 내용은 이용 약관을 참조하세요.