OPEN-SOURCE SCRIPT
Previous 5 Day Market Close
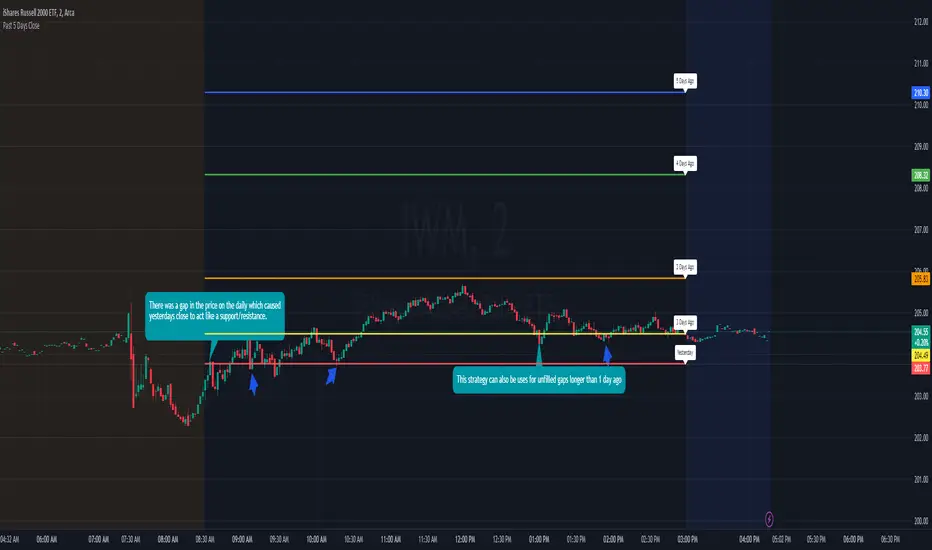
This indicator can be used with a strategy known as gap close reversal. Gap close reversal is a trading strategy based on the idea that when a market experiences a gap (a significant difference between the previous day's close and the current day's open), there's a tendency for the price to fill or "close" the gap by moving back to the previous day's closing price. Traders often look for such opportunities as potential entry or exit points.
Here's how you can use this script for gap close reversal trading:
Identify Gaps: Look for instances where the current day's open price significantly deviates from the previous day's close, resulting in a gap on the chart. This could be a gap-up (where the open is higher than the previous close) or a gap-down (where the open is lower than the previous close).
Plot the Script: Apply the "Past 5 Days Close" script to your chart. This will plot the closing prices of the past five trading days as lines on the chart. These lines will serve as reference points for potential gap close levels.
Look for Reversal Signals: Monitor the price action as the market opens and observe how it behaves in relation to the previous day's close and the lines plotted by the script. If the price starts to move towards one of the past closing prices after a gap, it could indicate a potential reversal.
Confirm with Other Indicators: Use additional technical indicators or chart patterns to confirm the potential reversal signal. For example, you might look for bullish or bearish candlestick patterns, support or resistance levels, or momentum indicators aligning with the reversal.
오픈 소스 스크립트
트레이딩뷰의 진정한 정신에 따라, 이 스크립트의 작성자는 이를 오픈소스로 공개하여 트레이더들이 기능을 검토하고 검증할 수 있도록 했습니다. 작성자에게 찬사를 보냅니다! 이 코드는 무료로 사용할 수 있지만, 코드를 재게시하는 경우 하우스 룰이 적용된다는 점을 기억하세요.
면책사항
해당 정보와 게시물은 금융, 투자, 트레이딩 또는 기타 유형의 조언이나 권장 사항으로 간주되지 않으며, 트레이딩뷰에서 제공하거나 보증하는 것이 아닙니다. 자세한 내용은 이용 약관을 참조하세요.
오픈 소스 스크립트
트레이딩뷰의 진정한 정신에 따라, 이 스크립트의 작성자는 이를 오픈소스로 공개하여 트레이더들이 기능을 검토하고 검증할 수 있도록 했습니다. 작성자에게 찬사를 보냅니다! 이 코드는 무료로 사용할 수 있지만, 코드를 재게시하는 경우 하우스 룰이 적용된다는 점을 기억하세요.
면책사항
해당 정보와 게시물은 금융, 투자, 트레이딩 또는 기타 유형의 조언이나 권장 사항으로 간주되지 않으며, 트레이딩뷰에서 제공하거나 보증하는 것이 아닙니다. 자세한 내용은 이용 약관을 참조하세요.