INVITE-ONLY SCRIPT
(15) Trade Risk Reduction VS-132
TRR calculates the volatility of your stock. This is just the magnitude of each days price fluctuations, or what technicians refer to as the True Range. TRR averages the True Range (ATR) over three different time periods.
Why three? You want a sensitive indicator that reflect both the long term historical volatility of the equity as well as what that volatility is right now. Obviously the most recent trading days are the most important. The three ATR periods and their weighting factors are:
1) We use a 251 day period which equates to 1 trading year because we want to know what the historical volatility is. This one year period is not weighted.
2) We utilize a 21 day period because the most recent weeks tells us what the stock volatility has been over the previous calendar month. This is weighted by a factor of 2.
3) Finally, we utilize the last weeks data, Last 5 days, (L5D) to provide us with the stocks movement in the most recent trading days. This is weighted by a factor of 4.
The total of ATR251*(1) + ATR21*(2) + ATR5*(4) is then divided by the total of all factors (7).
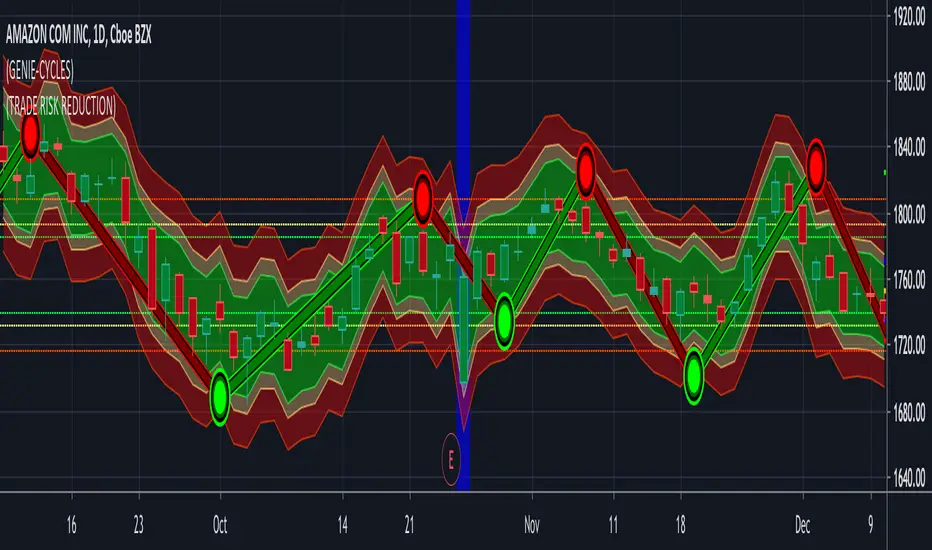
This results in the Weighted Average True Range that the Trade Risk Reduction utilizes to produce the dynamic bands on your charts as well as power the Risk and Stop loss calculators. These indicate where this indicator is currently recommending you place stops. In the Format options of the application you are provided with the ability to adjust these band. Keep in mind that each stock will act in it's own unique and characteristic way. Looking closely at the stock's historical data, both in longer and shorter time periods should provide you with some insight into the normal variations and fluctuations of this particular equity. Below EBAY provides an example of this.
Access this Genie indicator for your Tradingview account, through our web site. (Links Below) This will provide you with additional educational information and reference articles, videos, input and setting options and trading strategies this indicator excels in.
Why three? You want a sensitive indicator that reflect both the long term historical volatility of the equity as well as what that volatility is right now. Obviously the most recent trading days are the most important. The three ATR periods and their weighting factors are:
1) We use a 251 day period which equates to 1 trading year because we want to know what the historical volatility is. This one year period is not weighted.
2) We utilize a 21 day period because the most recent weeks tells us what the stock volatility has been over the previous calendar month. This is weighted by a factor of 2.
3) Finally, we utilize the last weeks data, Last 5 days, (L5D) to provide us with the stocks movement in the most recent trading days. This is weighted by a factor of 4.
The total of ATR251*(1) + ATR21*(2) + ATR5*(4) is then divided by the total of all factors (7).
This results in the Weighted Average True Range that the Trade Risk Reduction utilizes to produce the dynamic bands on your charts as well as power the Risk and Stop loss calculators. These indicate where this indicator is currently recommending you place stops. In the Format options of the application you are provided with the ability to adjust these band. Keep in mind that each stock will act in it's own unique and characteristic way. Looking closely at the stock's historical data, both in longer and shorter time periods should provide you with some insight into the normal variations and fluctuations of this particular equity. Below EBAY provides an example of this.
Access this Genie indicator for your Tradingview account, through our web site. (Links Below) This will provide you with additional educational information and reference articles, videos, input and setting options and trading strategies this indicator excels in.
초대 전용 스크립트
이 스크립트는 작성자가 승인한 사용자만 접근할 수 있습니다. 사용하려면 요청 후 승인을 받아야 하며, 일반적으로 결제 후에 허가가 부여됩니다. 자세한 내용은 아래 작성자의 안내를 따르거나 StockSwinger에게 직접 문의하세요.
트레이딩뷰는 스크립트의 작동 방식을 충분히 이해하고 작성자를 완전히 신뢰하지 않는 이상, 해당 스크립트에 비용을 지불하거나 사용하는 것을 권장하지 않습니다. 커뮤니티 스크립트에서 무료 오픈소스 대안을 찾아보실 수도 있습니다.
작성자 지시 사항
면책사항
해당 정보와 게시물은 금융, 투자, 트레이딩 또는 기타 유형의 조언이나 권장 사항으로 간주되지 않으며, 트레이딩뷰에서 제공하거나 보증하는 것이 아닙니다. 자세한 내용은 이용 약관을 참조하세요.