OPEN-SOURCE SCRIPT
Propagation Volumes and Trends
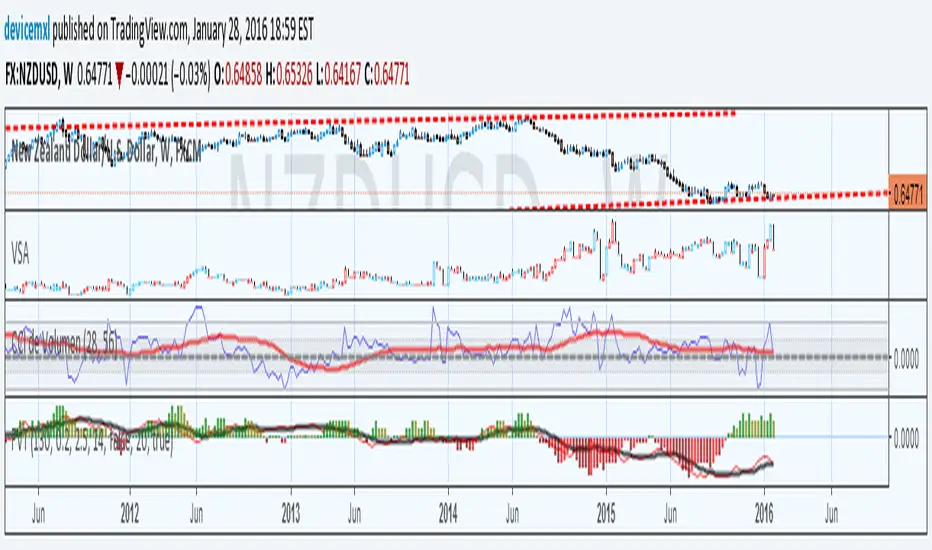
With this, i calculate RSI of the HL2 of the volume and use like an oscillator, this will use to measure the strength of the trend and the "Volume Flow" to follow the trend.
I use like foundation the LazyBear "Volume Flow Indicator" "honor a quien honor merece"
Background:
I think the volume as the price could be represented by candles or other graphic to use indicators and strengthen their analysis, due to lack of registration of this it is first necessary to calculate a volume graph, if the candle traditionally negative price brand then the total volume is taken as negative for the period. An example of this is in the On Balance Volume indicator, the problem is that there is no way to analyze the volume using other methods. An approximate volume of the spread could be the use of the price spread to make a synthetic behavior
As traditionally is observed if Open> Close then the candle and the volume will be negative and vice versa; the next step, is estimate the amounts of the candle necessary to calculate the ratio to use for the volume and thus idealize their spread within the candle:
VLOW = Volume x Low
vHigh = x High Volume
VOpen = vClose [1]
vClose = Volume x Close
This graph can show a stable synthetic form of fluctuations in the volume trend affected by price.
ideas, comments and suggestions (or corrections).They are always welcome
오픈 소스 스크립트
트레이딩뷰의 진정한 정신에 따라, 이 스크립트의 작성자는 이를 오픈소스로 공개하여 트레이더들이 기능을 검토하고 검증할 수 있도록 했습니다. 작성자에게 찬사를 보냅니다! 이 코드는 무료로 사용할 수 있지만, 코드를 재게시하는 경우 하우스 룰이 적용된다는 점을 기억하세요.
면책사항
해당 정보와 게시물은 금융, 투자, 트레이딩 또는 기타 유형의 조언이나 권장 사항으로 간주되지 않으며, 트레이딩뷰에서 제공하거나 보증하는 것이 아닙니다. 자세한 내용은 이용 약관을 참조하세요.
오픈 소스 스크립트
트레이딩뷰의 진정한 정신에 따라, 이 스크립트의 작성자는 이를 오픈소스로 공개하여 트레이더들이 기능을 검토하고 검증할 수 있도록 했습니다. 작성자에게 찬사를 보냅니다! 이 코드는 무료로 사용할 수 있지만, 코드를 재게시하는 경우 하우스 룰이 적용된다는 점을 기억하세요.
면책사항
해당 정보와 게시물은 금융, 투자, 트레이딩 또는 기타 유형의 조언이나 권장 사항으로 간주되지 않으며, 트레이딩뷰에서 제공하거나 보증하는 것이 아닙니다. 자세한 내용은 이용 약관을 참조하세요.