OPEN-SOURCE SCRIPT
업데이트됨 BE-EMA(12,26) (Blue Empire Exponential Moving Average)
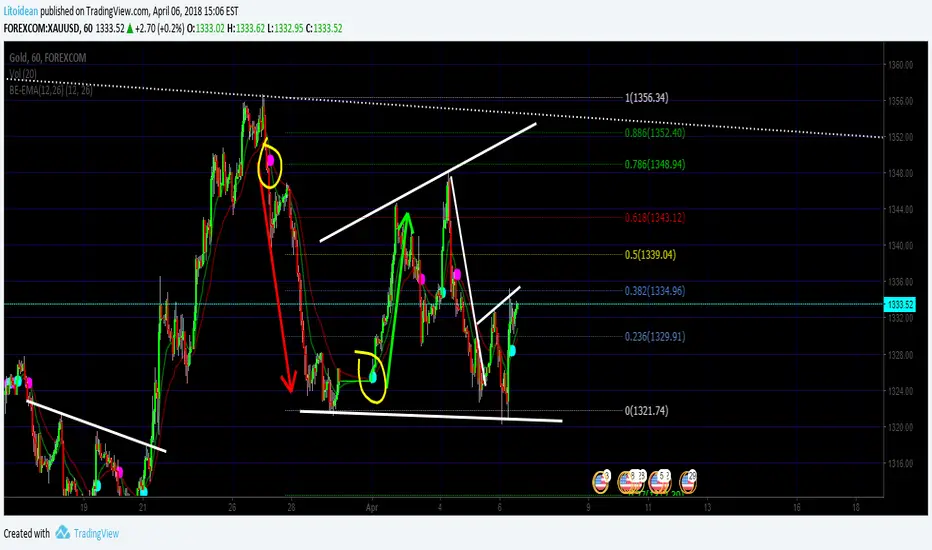
Simple EMA where you get a CROSS mark between EMA 12 and EMA 26.
Each time a cross happens, a spot gets created.
If it's cyan, it goes up.
If it's magenta, it goes down.
I'm studying Trading at Blue Empire Academy, if you want to know more send me a PM.
Wave Analysis study the wave's behavior and tries to predict by using trendlines, elliot waves, fibonacci retracements, and EMAs basically.
In this Indicator, It's a confirmation when EMA 12 goes over to confirm the price may go up. and Vice versa.
Hope you like, please share if you think it's useful and comment if you think this can be better.
Thank you again for reading
>> This is just an indicator, it doesn't predict the future. Use it at your own risk. <<
##########
All the credits to Tracks, a genius who helped me polish the code. :] thank you.
릴리즈 노트
Added - Extra 200 MA (Long-Period Indicator)오픈 소스 스크립트
트레이딩뷰의 진정한 정신에 따라, 이 스크립트의 작성자는 이를 오픈소스로 공개하여 트레이더들이 기능을 검토하고 검증할 수 있도록 했습니다. 작성자에게 찬사를 보냅니다! 이 코드는 무료로 사용할 수 있지만, 코드를 재게시하는 경우 하우스 룰이 적용된다는 점을 기억하세요.
면책사항
해당 정보와 게시물은 금융, 투자, 트레이딩 또는 기타 유형의 조언이나 권장 사항으로 간주되지 않으며, 트레이딩뷰에서 제공하거나 보증하는 것이 아닙니다. 자세한 내용은 이용 약관을 참조하세요.
오픈 소스 스크립트
트레이딩뷰의 진정한 정신에 따라, 이 스크립트의 작성자는 이를 오픈소스로 공개하여 트레이더들이 기능을 검토하고 검증할 수 있도록 했습니다. 작성자에게 찬사를 보냅니다! 이 코드는 무료로 사용할 수 있지만, 코드를 재게시하는 경우 하우스 룰이 적용된다는 점을 기억하세요.
면책사항
해당 정보와 게시물은 금융, 투자, 트레이딩 또는 기타 유형의 조언이나 권장 사항으로 간주되지 않으며, 트레이딩뷰에서 제공하거나 보증하는 것이 아닙니다. 자세한 내용은 이용 약관을 참조하세요.