INVITE-ONLY SCRIPT
업데이트됨 Stochastic Zone Strength Trend [wbburgin]
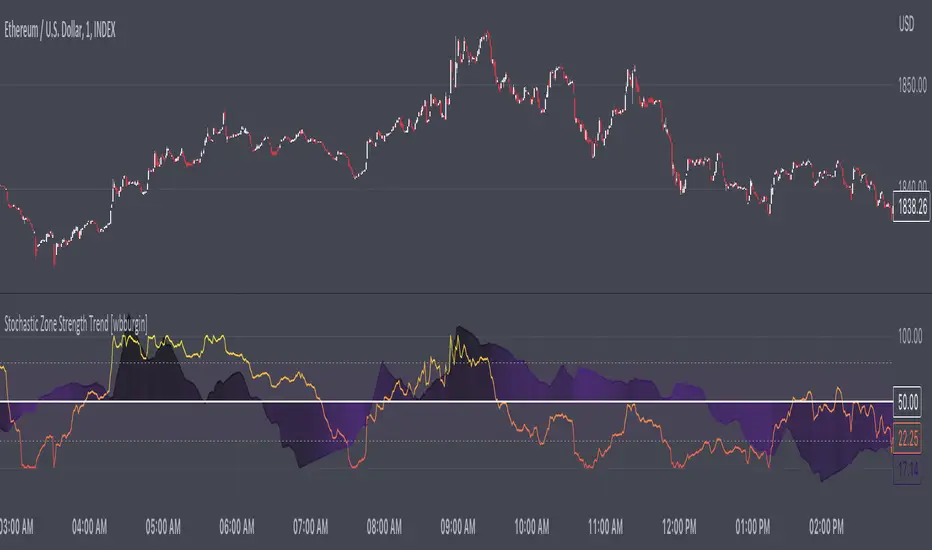
The Stochastic Zone Strength Trend indicator is a very powerful momentum and trend indicator that 1) identifies trend direction and strength, 2) determines pullbacks and reversals (including possible entry/exit conditions), 3) works on every instrument, and 4) can filter out ranges. I have some examples below on how to use it to its full effectiveness. It is composed of two components: Stochastic Zone Strength and Stochastic Trend Strength.
Stochastic Zone Strength
https://www.tradingview.com/x/cb54v0e6/
At its most basic level, the stochastic Zone Strength plots the momentum of the price action of the instrument, and identifies bearish and bullish changes with a high degree of accuracy. Think of the stochastic Zone Strength as a much more robust version of the RSI. Momentum-change thresholds are demonstrated by the "20" and "80" levels on the indicator (see below image).
https://www.tradingview.com/x/8263DA9I/
Stochastic Trend Strength
The stochastic Trend Strength component of the script uses resistance in each candlestick to calculate the trend strength of the instrument. I will go more into detail about the settings after my description of how to use the indicator, but there are two forms of the stochastic Trend Strength:
Anchored at 50 (directional stochastic Trend Strength:
https://www.tradingview.com/x/QLeUo8R1/
The directional stochastic Trend Strength can be used similarly to the MACD difference or other histogram-like indicators : a rising plot indicates an upward trend, while a falling plot indicates a downward trend.
Anchored at 0 (nondirectional stochastic Trend Strength:
https://www.tradingview.com/x/rX1catuo/
The nondirectional stochastic Trend Strength can be used similarly to the ADX or other non-directional indicators : a rising plot indicates increasing trend strength, and look at the stochastic Zone Strength component and your instrument to determine if this indicates increasing bullish strength or increasing bearish strength (see photo below):
https://www.tradingview.com/x/xMc6jJn5/
(In the above photo, a bearish divergence indicated that the high Trend Strength predicted a strong downwards move, which was confirmed shortly after. Later, a bullish move upward by the Zone Strength while the Trend Strength was elevated predicated a strong upwards move, which was also confirmed. Note the period where the Trend Strength never reached above 80, which indicated a ranging period (and thus unprofitable to enter or exit)).
How to Use the Indicator
https://www.tradingview.com/x/TsLR8Giw/
The above image is a good example on how to use the indicator to determine divergences and possible pivot points (lines and circles, respectively). I recommend using both the stochastic Zone Strength and the stochastic Trend Strength at the same time, as it can give you a robust picture of where momentum is in relation to the price action and its trajectory. Every color is changeable in the settings.
Settings
The Amplitude of the indicator is essentially the high-low lookback for both components.
The Wavelength of the indicator is how stretched-out you want the indicator to be: how many amplitudes do you want the indicator to process in one given bar.
A useful analogy that I use (and that I derived the names from) is from traditional physics. In wave motion, the Amplitude is the up-down sensitivity of the wave, and the Wavelength is the side-side stretch of the wave.
The Smoothing Factor of the settings is simply how smoothed you want the stochastic to be. It's not that important in most circumstances.
Trend Anchor was covered above (see my description of Trend Strength). The "Trend Transform MA Length" is the EMA length of the Trend Strength that you use to transform it into the directional oscillator. Think of the EMA being transformed onto the 50 line and then the Trend Strength being dragged relative to that.
Finally, the colors are changeable on the bottom.
Final Notes
As with previous and future invite-only scripts, I only restrict access to 1) maintain effectiveness of scripts, 2) because I use these scripts myself heavily, and/or 3) to support myself. Additionally, I will never make an restricted indicator that is not completely original in idea, scope, and execution.
Yours,
wbburgin
릴리즈 노트
IMPORTANT: This script has been deprecated and will now be released for public use on Thursday, June 28th. You may use the public script (same one) as you wish!초대 전용 스크립트
이 스크립트는 작성자가 승인한 사용자만 접근할 수 있습니다. 사용하려면 요청 후 승인을 받아야 하며, 일반적으로 결제 후에 허가가 부여됩니다. 자세한 내용은 아래 작성자의 안내를 따르거나 wbburgin에게 직접 문의하세요.
트레이딩뷰는 스크립트의 작동 방식을 충분히 이해하고 작성자를 완전히 신뢰하지 않는 이상, 해당 스크립트에 비용을 지불하거나 사용하는 것을 권장하지 않습니다. 커뮤니티 스크립트에서 무료 오픈소스 대안을 찾아보실 수도 있습니다.
작성자 지시 사항
Please follow the link in my profile or in my signature to be granted access to the indicator. I really hope you all find it useful!
FAQ: I am gradually phasing out my Patreon because of the time it takes to maintain.
BTC: 35PdMMMXFCvPjXKwn8wsRFNwMEPgStaKUJ
Test my strategies on CryptoRobotics: cryptorobotics.co/?trade=f23b09
BTC: 35PdMMMXFCvPjXKwn8wsRFNwMEPgStaKUJ
Test my strategies on CryptoRobotics: cryptorobotics.co/?trade=f23b09
면책사항
해당 정보와 게시물은 금융, 투자, 트레이딩 또는 기타 유형의 조언이나 권장 사항으로 간주되지 않으며, 트레이딩뷰에서 제공하거나 보증하는 것이 아닙니다. 자세한 내용은 이용 약관을 참조하세요.
초대 전용 스크립트
이 스크립트는 작성자가 승인한 사용자만 접근할 수 있습니다. 사용하려면 요청 후 승인을 받아야 하며, 일반적으로 결제 후에 허가가 부여됩니다. 자세한 내용은 아래 작성자의 안내를 따르거나 wbburgin에게 직접 문의하세요.
트레이딩뷰는 스크립트의 작동 방식을 충분히 이해하고 작성자를 완전히 신뢰하지 않는 이상, 해당 스크립트에 비용을 지불하거나 사용하는 것을 권장하지 않습니다. 커뮤니티 스크립트에서 무료 오픈소스 대안을 찾아보실 수도 있습니다.
작성자 지시 사항
Please follow the link in my profile or in my signature to be granted access to the indicator. I really hope you all find it useful!
FAQ: I am gradually phasing out my Patreon because of the time it takes to maintain.
BTC: 35PdMMMXFCvPjXKwn8wsRFNwMEPgStaKUJ
Test my strategies on CryptoRobotics: cryptorobotics.co/?trade=f23b09
BTC: 35PdMMMXFCvPjXKwn8wsRFNwMEPgStaKUJ
Test my strategies on CryptoRobotics: cryptorobotics.co/?trade=f23b09
면책사항
해당 정보와 게시물은 금융, 투자, 트레이딩 또는 기타 유형의 조언이나 권장 사항으로 간주되지 않으며, 트레이딩뷰에서 제공하거나 보증하는 것이 아닙니다. 자세한 내용은 이용 약관을 참조하세요.