OPEN-SOURCE SCRIPT
업데이트됨 Parabolic SAR Deviation [BigBeluga]
Parabolic SAR + Deviation [BigBeluga] is an enhanced Parabolic SAR indicator designed to detect trends while incorporating deviation levels and trend change markers for added depth in analyzing price movements.
🔵Key Features:
> Parabolic SAR with Optimized Settings:
🔵Usage:
Parabolic SAR + Deviation [BigBeluga] is an essential tool for traders seeking a straightforward yet powerful method to identify trends, analyze price deviations, and gain insights into volume dynamics at critical breakout and trend change levels.
🔵Key Features:
> Parabolic SAR with Optimized Settings:
- Built on the classic Parabolic SAR, this version uses predefined default settings to enhance its ability to detect and confirm trends.
- Clear trend direction is indicated by smooth trend lines, allowing traders to easily visualize market movements.
- Trend Change Markers:
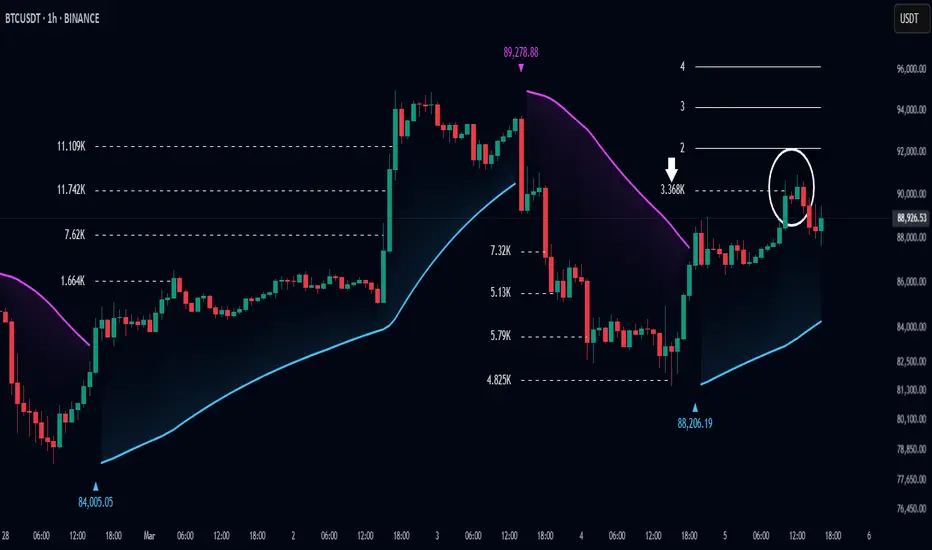
- When a trend change occurs based on the SAR, the indicator plots a triangle at the trend change point.
- The triangle is accompanied by the price value of the trend change, allowing traders to identify key reversal points instantly.
> Deviation Levels:
- Four deviation levels are automatically plotted when a trend change occurs (up or down).
- Uptrend: Deviation levels are positioned above the entry point.
- Downtrend: Deviation levels are positioned below the entry point.
- Levels are labeled with numbers 1 to 4, representing increasing degrees of deviation.
> Dynamic Level Updates: - When the price crosses a deviation level, the level becomes dashed and its label changes to display the volume at the breakout point.
- This volume information helps traders assess the strength of the breakout and the potential for trend continuation or reversal.
> Volume Analysis at Breakpoints: - The volume displayed at crossed deviation levels provides insight into the strength of the price movement.
- High volume at a breakout may indicate strong momentum, while low volume could signal potential exhaustion or a false breakout.
🔵Usage:
- Identify Trends: Use the trend change triangles and smooth SAR trend lines to confirm whether the market is trending up or down.
- Analyze Deviation Levels: Monitor deviation levels **1–4** to identify potential breakout points and assess the degree of price deviation from the entry point.
- Observe Trend Change Points: Utilize the triangles and price labels to quickly spot significant trend changes.
- Volume Insights: Evaluate the volume displayed at crossed levels to determine the strength of the breakout and assess the likelihood of trend continuation or reversal.
- Risk Management: Use deviation levels as potential stop-loss or take-profit zones, depending on the strength of the trend and volume conditions.
Parabolic SAR + Deviation [BigBeluga] is an essential tool for traders seeking a straightforward yet powerful method to identify trends, analyze price deviations, and gain insights into volume dynamics at critical breakout and trend change levels.
릴리즈 노트
- Bug fix of lines and labels arrays오픈 소스 스크립트
트레이딩뷰의 진정한 정신에 따라, 이 스크립트의 작성자는 이를 오픈소스로 공개하여 트레이더들이 기능을 검토하고 검증할 수 있도록 했습니다. 작성자에게 찬사를 보냅니다! 이 코드는 무료로 사용할 수 있지만, 코드를 재게시하는 경우 하우스 룰이 적용된다는 점을 기억하세요.
🔵Gain access to our powerful tools : bigbeluga.com/tv
🔵Join our free discord for updates : bigbeluga.com/discord
All scripts & content provided by BigBeluga are for informational & educational purposes only.
🔵Join our free discord for updates : bigbeluga.com/discord
All scripts & content provided by BigBeluga are for informational & educational purposes only.
면책사항
해당 정보와 게시물은 금융, 투자, 트레이딩 또는 기타 유형의 조언이나 권장 사항으로 간주되지 않으며, 트레이딩뷰에서 제공하거나 보증하는 것이 아닙니다. 자세한 내용은 이용 약관을 참조하세요.
오픈 소스 스크립트
트레이딩뷰의 진정한 정신에 따라, 이 스크립트의 작성자는 이를 오픈소스로 공개하여 트레이더들이 기능을 검토하고 검증할 수 있도록 했습니다. 작성자에게 찬사를 보냅니다! 이 코드는 무료로 사용할 수 있지만, 코드를 재게시하는 경우 하우스 룰이 적용된다는 점을 기억하세요.
🔵Gain access to our powerful tools : bigbeluga.com/tv
🔵Join our free discord for updates : bigbeluga.com/discord
All scripts & content provided by BigBeluga are for informational & educational purposes only.
🔵Join our free discord for updates : bigbeluga.com/discord
All scripts & content provided by BigBeluga are for informational & educational purposes only.
면책사항
해당 정보와 게시물은 금융, 투자, 트레이딩 또는 기타 유형의 조언이나 권장 사항으로 간주되지 않으며, 트레이딩뷰에서 제공하거나 보증하는 것이 아닙니다. 자세한 내용은 이용 약관을 참조하세요.