OPEN-SOURCE SCRIPT
EMA Channel Key K-Lines
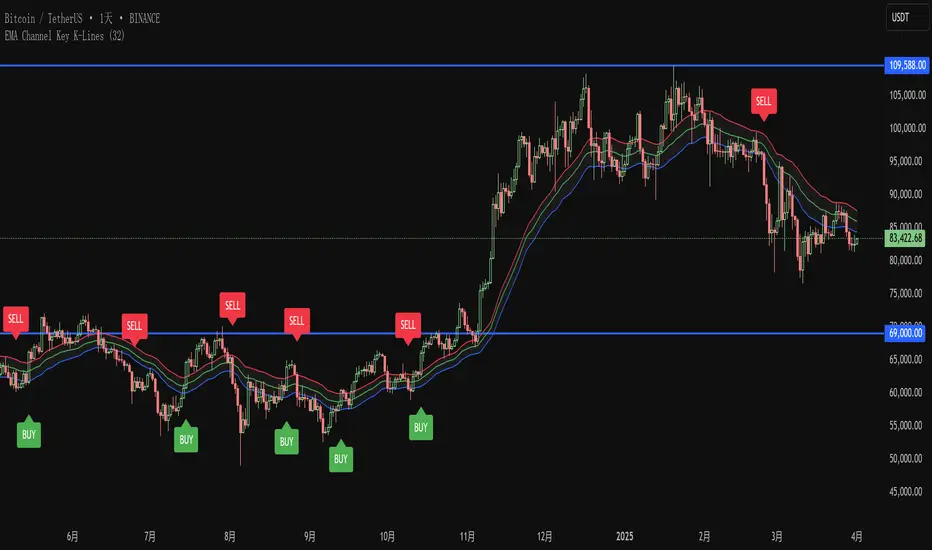
EMA Channel Setup:
Key K-line Identification:
Visual Markers:
Logic Flow:
- Three 32-period EMAs (high, low, close prices)
- Visually distinct colors (red, blue, green)
- Gray background between high and low EMAs
Key K-line Identification:
- For buy signals: Close > highest EMA, K-line height ≥ channel height, body ≥ 2/3 of range
- For sell signals: Close < lowest EMA, K-line height ≥ channel height, body ≥ 2/3 of range
- Alternating signals only (no consecutive buy/sell signals)
Visual Markers:
- Green "BUY" labels below key buy K-lines
- Red "SELL" labels above key sell K-lines
- Clear channel visualization
Logic Flow:
- Tracks last signal direction to prevent consecutive same-type signals
- Strict conditions ensure only significant breakouts are marked
- All calculations based on your exact specifications
오픈 소스 스크립트
트레이딩뷰의 진정한 정신에 따라, 이 스크립트의 작성자는 이를 오픈소스로 공개하여 트레이더들이 기능을 검토하고 검증할 수 있도록 했습니다. 작성자에게 찬사를 보냅니다! 이 코드는 무료로 사용할 수 있지만, 코드를 재게시하는 경우 하우스 룰이 적용된다는 점을 기억하세요.
면책사항
해당 정보와 게시물은 금융, 투자, 트레이딩 또는 기타 유형의 조언이나 권장 사항으로 간주되지 않으며, 트레이딩뷰에서 제공하거나 보증하는 것이 아닙니다. 자세한 내용은 이용 약관을 참조하세요.
오픈 소스 스크립트
트레이딩뷰의 진정한 정신에 따라, 이 스크립트의 작성자는 이를 오픈소스로 공개하여 트레이더들이 기능을 검토하고 검증할 수 있도록 했습니다. 작성자에게 찬사를 보냅니다! 이 코드는 무료로 사용할 수 있지만, 코드를 재게시하는 경우 하우스 룰이 적용된다는 점을 기억하세요.
면책사항
해당 정보와 게시물은 금융, 투자, 트레이딩 또는 기타 유형의 조언이나 권장 사항으로 간주되지 않으며, 트레이딩뷰에서 제공하거나 보증하는 것이 아닙니다. 자세한 내용은 이용 약관을 참조하세요.