OPEN-SOURCE SCRIPT
업데이트됨 SMA 119
Sometimes simplicity is a key.
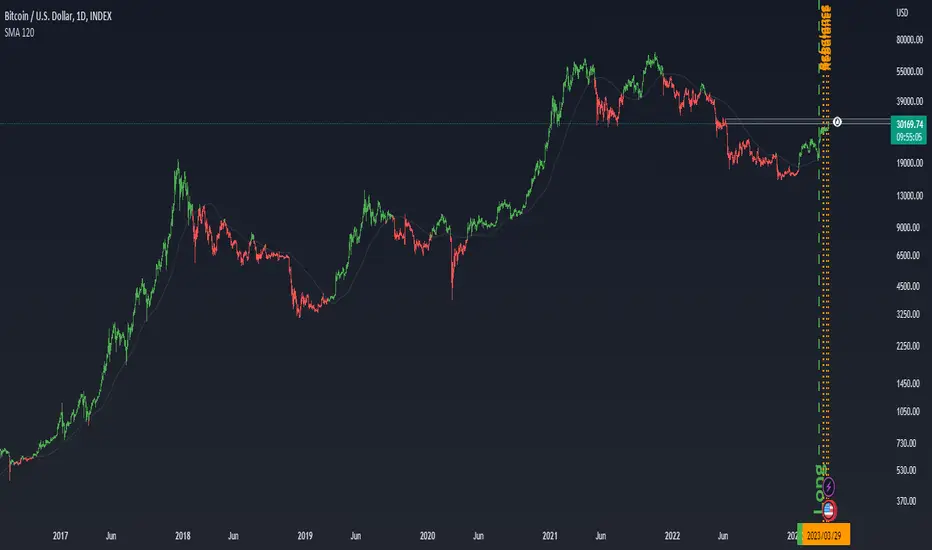
This is a Simple Moving Average of 119 period on daily timeframe.
When hl2 of price is above SMA it plot green candles (up trend), when below it plot red candles (down trend)
So it shows you a long term direction of BTC
It is very useful indicator to see in what stage BTC is now, Bear or Bull. Yes it seems to be very simple, but it works.
Sometimes to dig a hole, you dont need an excavator you just need an shovel. In this case shovel is a SMA =)
BackTest of indicator
https://www.tradingview.com/x/boR3okbF
릴리즈 노트
-오픈 소스 스크립트
진정한 트레이딩뷰 정신에 따라 이 스크립트 작성자는 트레이더가 기능을 검토하고 검증할 수 있도록 오픈소스로 공개했습니다. 작성자에게 찬사를 보냅니다! 무료로 사용할 수 있지만 코드를 다시 게시할 경우 하우스 룰이 적용된다는 점을 기억하세요.
면책사항
이 정보와 게시물은 TradingView에서 제공하거나 보증하는 금융, 투자, 거래 또는 기타 유형의 조언이나 권고 사항을 의미하거나 구성하지 않습니다. 자세한 내용은 이용 약관을 참고하세요.
오픈 소스 스크립트
진정한 트레이딩뷰 정신에 따라 이 스크립트 작성자는 트레이더가 기능을 검토하고 검증할 수 있도록 오픈소스로 공개했습니다. 작성자에게 찬사를 보냅니다! 무료로 사용할 수 있지만 코드를 다시 게시할 경우 하우스 룰이 적용된다는 점을 기억하세요.
면책사항
이 정보와 게시물은 TradingView에서 제공하거나 보증하는 금융, 투자, 거래 또는 기타 유형의 조언이나 권고 사항을 의미하거나 구성하지 않습니다. 자세한 내용은 이용 약관을 참고하세요.