OPEN-SOURCE SCRIPT
업데이트됨 CISD by tncylyv
CISD (Change in State of Delivery) by tncylyv
The CISD (Change in State of Delivery) indicator is a precision price action tool designed to help traders identify key reversal points based on ICT concepts. Unlike standard support and resistance indicators, this script tracks the specific algorithmic opening prices responsible for the current delivery state and highlights when that state has been invalidated.
🧠 What is CISD?
Change in State of Delivery refers to the moment price shifts from a Buy Program to a Sell Program (or vice versa).
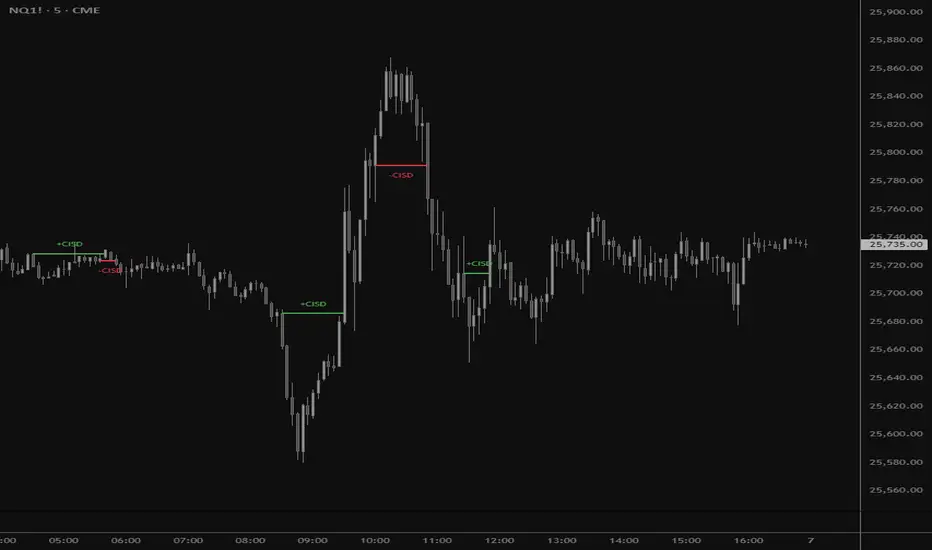
• Bearish CISD (-CISD): Occurs when price closes below the opening price of the up-candle sequence that created the most recent High.
• Bullish CISD (+CISD): Occurs when price closes above the opening price of the down-candle sequence that created the most recent Low.
This indicator automates the identification of these levels, tracking the "Active" reference price in real-time and marking historical reversals.
🚀 Key Features
1. Continuous Active Level Tracking:
o The indicator plots a continuous, stepped line (The "Active CISD") that follows the market structure. As the market expands (makes new highs or lows), the line updates to the new valid reference point.
o This allows you to see the current invalidation level at a glance without cluttering the chart with old lines.
2. Triggered Reversal Lines:
o When a candle closes beyond the Active CISD level, a "Triggered" line is drawn to mark the exact price and location of the reversal.
o These lines serve as excellent historical references for potential Order Blocks or Breakers later in time.
3. Smart Filtering:
o You can choose to display Both Bullish and Bearish setups, or filter to see Bullish Only or Bearish Only. This is ideal for traders who have a specific daily bias and want to remove noise from the chart.
4. Clean & Customizable:
o Fully customizable colors for Bullish and Bearish events.
o Options to toggle Labels, adjust Line Width, and change Line Styles (Solid, Dashed, Dotted).
o "No Continuation" Logic: This version focuses purely on major reversals (Change in State) rather than minor pullbacks, keeping your chart clean.
⚙️ Settings Guide
• Show Active CISD Level: Toggles the continuous stepped line representing the current threshold for a reversal.
• Triggered CISD Display: Choose between Both, Bullish Only, Bearish Only, or None. This controls the historical lines left behind after a reversal occurs.
• Visual Settings: Adjust line width, label sizes, and font styles to match your chart aesthetic.
• Colors: Customize the Shrek Mode (Bullish) and Blood Bath (Bearish) colors.
⚠️ A Note for Developers
This indicator is open source! If you are a Pine Script developer, feel free to check the source code. I’ve utilized some... creative variable naming conventions to make the coding experience more entertaining. Enjoy the read!
________________________________________
Risk Disclaimer: This tool is for educational purposes and market analysis. It does not guarantee future performance. Always manage your risk.
The CISD (Change in State of Delivery) indicator is a precision price action tool designed to help traders identify key reversal points based on ICT concepts. Unlike standard support and resistance indicators, this script tracks the specific algorithmic opening prices responsible for the current delivery state and highlights when that state has been invalidated.
🧠 What is CISD?
Change in State of Delivery refers to the moment price shifts from a Buy Program to a Sell Program (or vice versa).
• Bearish CISD (-CISD): Occurs when price closes below the opening price of the up-candle sequence that created the most recent High.
• Bullish CISD (+CISD): Occurs when price closes above the opening price of the down-candle sequence that created the most recent Low.
This indicator automates the identification of these levels, tracking the "Active" reference price in real-time and marking historical reversals.
🚀 Key Features
1. Continuous Active Level Tracking:
o The indicator plots a continuous, stepped line (The "Active CISD") that follows the market structure. As the market expands (makes new highs or lows), the line updates to the new valid reference point.
o This allows you to see the current invalidation level at a glance without cluttering the chart with old lines.
2. Triggered Reversal Lines:
o When a candle closes beyond the Active CISD level, a "Triggered" line is drawn to mark the exact price and location of the reversal.
o These lines serve as excellent historical references for potential Order Blocks or Breakers later in time.
3. Smart Filtering:
o You can choose to display Both Bullish and Bearish setups, or filter to see Bullish Only or Bearish Only. This is ideal for traders who have a specific daily bias and want to remove noise from the chart.
4. Clean & Customizable:
o Fully customizable colors for Bullish and Bearish events.
o Options to toggle Labels, adjust Line Width, and change Line Styles (Solid, Dashed, Dotted).
o "No Continuation" Logic: This version focuses purely on major reversals (Change in State) rather than minor pullbacks, keeping your chart clean.
⚙️ Settings Guide
• Show Active CISD Level: Toggles the continuous stepped line representing the current threshold for a reversal.
• Triggered CISD Display: Choose between Both, Bullish Only, Bearish Only, or None. This controls the historical lines left behind after a reversal occurs.
• Visual Settings: Adjust line width, label sizes, and font styles to match your chart aesthetic.
• Colors: Customize the Shrek Mode (Bullish) and Blood Bath (Bearish) colors.
⚠️ A Note for Developers
This indicator is open source! If you are a Pine Script developer, feel free to check the source code. I’ve utilized some... creative variable naming conventions to make the coding experience more entertaining. Enjoy the read!
________________________________________
Risk Disclaimer: This tool is for educational purposes and market analysis. It does not guarantee future performance. Always manage your risk.
릴리즈 노트
+ Added option to show only limited number of CISDs릴리즈 노트
This update introduces a comprehensive Multi-Timeframe (MTF) Trend Status Table to the indicator, providing a holistic view of market bias at a glance.Key Features:
• MTF Analysis: Automatically tracks and displays the trend direction across 8 distinct timeframes: 1m, 3m, 5m, 15m, 1H, 4H, 1D, and 1W.
• CISD Logic Integration: The trend status (Bullish/Bearish) is derived directly from the current Change in State of Delivery (CISD) logic, ensuring consistency between the chart overlay and the dashboard.
• Customizable Interface: A new settings group has been added, allowing users to toggle the table’s visibility, adjust its position on the chart, and modify the display size to fit their workspace.
릴리즈 노트
//small table bug fix오픈 소스 스크립트
트레이딩뷰의 진정한 정신에 따라, 이 스크립트의 작성자는 이를 오픈소스로 공개하여 트레이더들이 기능을 검토하고 검증할 수 있도록 했습니다. 작성자에게 찬사를 보냅니다! 이 코드는 무료로 사용할 수 있지만, 코드를 재게시하는 경우 하우스 룰이 적용된다는 점을 기억하세요.
면책사항
해당 정보와 게시물은 금융, 투자, 트레이딩 또는 기타 유형의 조언이나 권장 사항으로 간주되지 않으며, 트레이딩뷰에서 제공하거나 보증하는 것이 아닙니다. 자세한 내용은 이용 약관을 참조하세요.
오픈 소스 스크립트
트레이딩뷰의 진정한 정신에 따라, 이 스크립트의 작성자는 이를 오픈소스로 공개하여 트레이더들이 기능을 검토하고 검증할 수 있도록 했습니다. 작성자에게 찬사를 보냅니다! 이 코드는 무료로 사용할 수 있지만, 코드를 재게시하는 경우 하우스 룰이 적용된다는 점을 기억하세요.
면책사항
해당 정보와 게시물은 금융, 투자, 트레이딩 또는 기타 유형의 조언이나 권장 사항으로 간주되지 않으며, 트레이딩뷰에서 제공하거나 보증하는 것이 아닙니다. 자세한 내용은 이용 약관을 참조하세요.