OPEN-SOURCE SCRIPT
Radial Basis Kernel RSI for Loop
Radial Basis Kernel RSI for Loop
What it is
An RSI-style oscillator that uses a radial basis function (RBF) kernel to compute a similarity-weighted average of gains and losses across many lookback lengths and kernel widths (γ). By averaging dozens of RSI estimates—each built with different parameters—it aims to deliver a smoother, more robust momentum signal that adapts to changing market conditions.
How it works
The script measures up/down price changes from your chosen Source (default: close).
For each combination of RSI length and Gamma (γ) in your ranges, it builds an RSI where recent bars that look most similar (by price behavior) get more weight via an RBF kernel.
It averages all those RSIs into a single value, then smooths it with your selected Moving Average type (SMA, EMA, WMA, HMA, DEMA) and a light regression-based filter for stability.
Inputs you can tune
Min/Max RSI Kernel Length & Step: Range of RSI lookbacks to include in the ensemble (e.g., 20→40 by 1) or (e.g., 30→50 by 1).
Min/Max Gamma & Step: Controls the RBF “width.” Lower γ = broader similarity (smoother); higher γ = more selective (snappier).
Source: Price series to analyze.
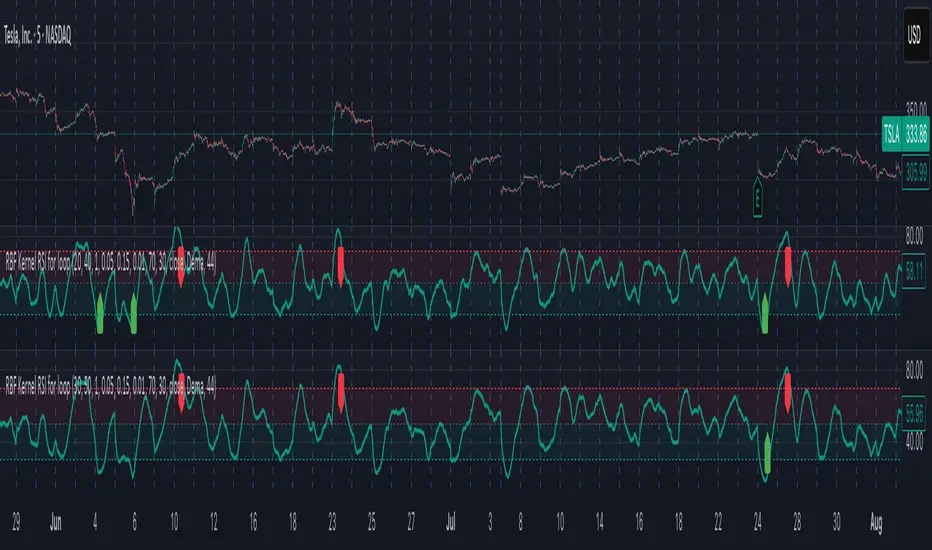
Overbought / Oversold levels: Defaults 70 / 30, with a midline at 50. Shaded regions help visualize extremes.
MA Type & Period (Confluence): Final smoothing on the averaged RSI line (e.g., DEMA(44) by default).
Red “OB” labels when the line crosses down from extreme highs (~80) → potential overbought fade/exit areas.
Green “OS” labels when the line crosses up from extreme lows (~20) → potential oversold bounce/entry areas.
How to use it
Treat it like RSI, but expect fewer whipsaws thanks to the ensemble and kernel weighting.
Common approaches:
Look for crosses back inside the bands (e.g., down from >70 or up from <30).
Use the 50 midline for directional bias (above = bullish momentum tilt; below = bearish).
Combine with trend filters (e.g., your chart MA) for higher-probability signals.
Performance note: This is really heavy and depending on how much time your subscription allows you could experience this timing out. Increasing the step size is the easiest way to reduce the load time.
Works on any symbol or timeframe. Like any oscillator, best used alongside price action and risk management rather than in isolation.
What it is
An RSI-style oscillator that uses a radial basis function (RBF) kernel to compute a similarity-weighted average of gains and losses across many lookback lengths and kernel widths (γ). By averaging dozens of RSI estimates—each built with different parameters—it aims to deliver a smoother, more robust momentum signal that adapts to changing market conditions.
How it works
The script measures up/down price changes from your chosen Source (default: close).
For each combination of RSI length and Gamma (γ) in your ranges, it builds an RSI where recent bars that look most similar (by price behavior) get more weight via an RBF kernel.
It averages all those RSIs into a single value, then smooths it with your selected Moving Average type (SMA, EMA, WMA, HMA, DEMA) and a light regression-based filter for stability.
Inputs you can tune
Min/Max RSI Kernel Length & Step: Range of RSI lookbacks to include in the ensemble (e.g., 20→40 by 1) or (e.g., 30→50 by 1).
Min/Max Gamma & Step: Controls the RBF “width.” Lower γ = broader similarity (smoother); higher γ = more selective (snappier).
Source: Price series to analyze.
Overbought / Oversold levels: Defaults 70 / 30, with a midline at 50. Shaded regions help visualize extremes.
MA Type & Period (Confluence): Final smoothing on the averaged RSI line (e.g., DEMA(44) by default).
Red “OB” labels when the line crosses down from extreme highs (~80) → potential overbought fade/exit areas.
Green “OS” labels when the line crosses up from extreme lows (~20) → potential oversold bounce/entry areas.
How to use it
Treat it like RSI, but expect fewer whipsaws thanks to the ensemble and kernel weighting.
Common approaches:
Look for crosses back inside the bands (e.g., down from >70 or up from <30).
Use the 50 midline for directional bias (above = bullish momentum tilt; below = bearish).
Combine with trend filters (e.g., your chart MA) for higher-probability signals.
Performance note: This is really heavy and depending on how much time your subscription allows you could experience this timing out. Increasing the step size is the easiest way to reduce the load time.
Works on any symbol or timeframe. Like any oscillator, best used alongside price action and risk management rather than in isolation.
오픈 소스 스크립트
트레이딩뷰의 진정한 정신에 따라, 이 스크립트의 작성자는 이를 오픈소스로 공개하여 트레이더들이 기능을 검토하고 검증할 수 있도록 했습니다. 작성자에게 찬사를 보냅니다! 이 코드는 무료로 사용할 수 있지만, 코드를 재게시하는 경우 하우스 룰이 적용된다는 점을 기억하세요.
면책사항
해당 정보와 게시물은 금융, 투자, 트레이딩 또는 기타 유형의 조언이나 권장 사항으로 간주되지 않으며, 트레이딩뷰에서 제공하거나 보증하는 것이 아닙니다. 자세한 내용은 이용 약관을 참조하세요.
오픈 소스 스크립트
트레이딩뷰의 진정한 정신에 따라, 이 스크립트의 작성자는 이를 오픈소스로 공개하여 트레이더들이 기능을 검토하고 검증할 수 있도록 했습니다. 작성자에게 찬사를 보냅니다! 이 코드는 무료로 사용할 수 있지만, 코드를 재게시하는 경우 하우스 룰이 적용된다는 점을 기억하세요.
면책사항
해당 정보와 게시물은 금융, 투자, 트레이딩 또는 기타 유형의 조언이나 권장 사항으로 간주되지 않으며, 트레이딩뷰에서 제공하거나 보증하는 것이 아닙니다. 자세한 내용은 이용 약관을 참조하세요.