OPEN-SOURCE SCRIPT
업데이트됨 Irrationality Index by CRYPTO_ADA_BTC
"The market can be irrational longer than you can stay solvent" ~ John Maynard Keynes
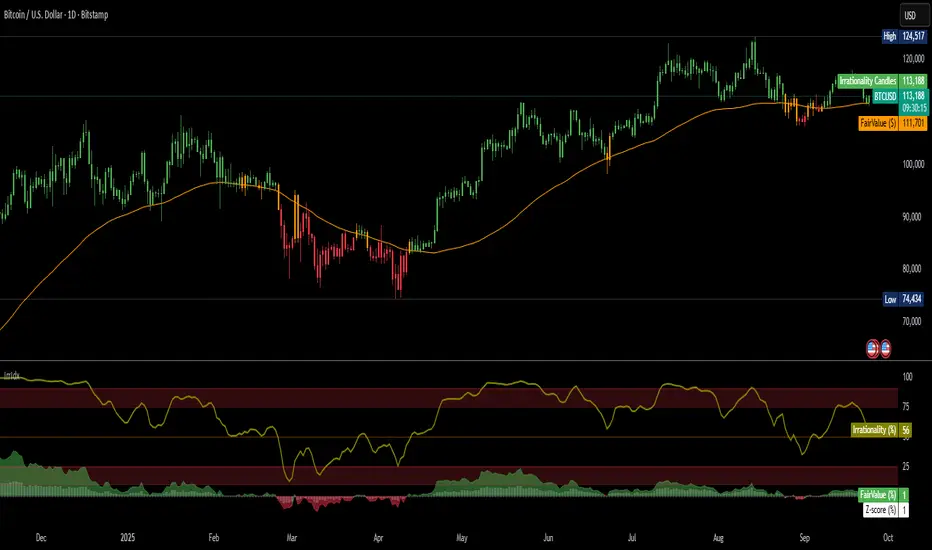
This indicator, the Irrationality Index, measures how far the current market price has deviated from a smoothed estimate of its "fair value," normalized for recent volatility. It provides traders with a visual sense of when the market may be behaving irrationally, without giving direct buy or sell signals.
How it works:
1. Fair Value Calculation
The indicator estimates a "fair value" for the asset using a combination of a long-term EMA (exponential moving average) and a linear regression trend over a configurable period. This fair value serves as a smoothed baseline for price, balancing trend-following and mean-reversion.
2. Volatility-Adjusted Z-Score
The deviation between price and fair value is measured in standard deviations of recent log returns:
Pine Script®
This standardization accounts for different volatility environments, allowing comparison across assets.
3. Irrationality Score (0–100)
The Z-score is transformed using a logistic mapping into a 0–100 scale:
- 50 → price near fair value (rational zone)
- >75 → high irrationality, price stretched above fair value
- >90 → extreme irrationality, unsustainable extremes
- <25 → high irrationality, price stretched below fair value
- <10 → extreme bearish irrationality
4. Price vs Fair Value (% deviation)
The indicator plots the percentage difference between price and fair value:
Pine Script®
- Positive values → Percentage above fair value (optimistic / overvalued)
- Negative values → Percentage below fair value (pessimistic / undervalued)
Visuals:
- Irrationality (%) Line (0–100) shows irrationality level.
- Background Colors: Yellow= high bullish irrationality, Green= extreme bullish irrationality, Orange= high bearish irrationality, Red= extreme bearish irrationality.
- Price - FairValue (%) plot: price deviation vs fair value (%), Colored green above 0 and red below 0.
- Label: display actual price, estimated fair value, and Z-score for the latest bar.
- Alerts: configurable thresholds for high and extreme irrationality.
How to read it:
- 50 → Market trading near fair value.
- >75 / >90 → Price may be irrationally high; risk of pullback increases.
- <25 / <10 → Price may be irrationally low; potential rebound zones, but trends can continue.
- Price - FairValue (%) plot → visual guide for % price stretch relative to fair value.
Notes / Warnings:
- Measures relative deviation, not fundamental value!
- High irrationality scores do not automatically indicate trades; markets can remain can be irrational longer than you can stay solvent.
- Best used with other tools: momentum, volume, divergence, and multi-timeframe analysis.
This indicator, the Irrationality Index, measures how far the current market price has deviated from a smoothed estimate of its "fair value," normalized for recent volatility. It provides traders with a visual sense of when the market may be behaving irrationally, without giving direct buy or sell signals.
How it works:
1. Fair Value Calculation
The indicator estimates a "fair value" for the asset using a combination of a long-term EMA (exponential moving average) and a linear regression trend over a configurable period. This fair value serves as a smoothed baseline for price, balancing trend-following and mean-reversion.
2. Volatility-Adjusted Z-Score
The deviation between price and fair value is measured in standard deviations of recent log returns:
Z = (log(price) - log(fairValue)) / volatility
This standardization accounts for different volatility environments, allowing comparison across assets.
3. Irrationality Score (0–100)
The Z-score is transformed using a logistic mapping into a 0–100 scale:
- 50 → price near fair value (rational zone)
- >75 → high irrationality, price stretched above fair value
- >90 → extreme irrationality, unsustainable extremes
- <25 → high irrationality, price stretched below fair value
- <10 → extreme bearish irrationality
4. Price vs Fair Value (% deviation)
The indicator plots the percentage difference between price and fair value:
pctDiff = (price - fairValue) / fairValue * 100
- Positive values → Percentage above fair value (optimistic / overvalued)
- Negative values → Percentage below fair value (pessimistic / undervalued)
Visuals:
- Irrationality (%) Line (0–100) shows irrationality level.
- Background Colors: Yellow= high bullish irrationality, Green= extreme bullish irrationality, Orange= high bearish irrationality, Red= extreme bearish irrationality.
- Price - FairValue (%) plot: price deviation vs fair value (%), Colored green above 0 and red below 0.
- Label: display actual price, estimated fair value, and Z-score for the latest bar.
- Alerts: configurable thresholds for high and extreme irrationality.
How to read it:
- 50 → Market trading near fair value.
- >75 / >90 → Price may be irrationally high; risk of pullback increases.
- <25 / <10 → Price may be irrationally low; potential rebound zones, but trends can continue.
- Price - FairValue (%) plot → visual guide for % price stretch relative to fair value.
Notes / Warnings:
- Measures relative deviation, not fundamental value!
- High irrationality scores do not automatically indicate trades; markets can remain can be irrational longer than you can stay solvent.
- Best used with other tools: momentum, volume, divergence, and multi-timeframe analysis.
릴리즈 노트
"The market can be irrational longer than you can stay solvent" ~ John Maynard KeynesThis indicator, the Irrationality Index, measures how far the current market price has deviated from a smoothed estimate of its "fair value," normalized for recent volatility. It provides traders with a visual sense of when the market may be behaving irrationally, without giving direct buy or sell signals.
How it works:
1. Fair Value Calculation
The indicator estimates a "fair value" for the asset using a combination of a long-term EMA (exponential moving average) and a linear regression trend over a configurable period. This fair value serves as a smoothed baseline for price, balancing trend-following and mean-reversion.
2. Volatility-Adjusted Z-Score
The deviation between price and fair value is measured in standard deviations of recent log returns:
Z = (log(price) - log(fairValue)) / volatility
This standardization accounts for different volatility environments, allowing comparison across assets.
3. Irrationality Score (0–100)
The Z-score is transformed using a logistic mapping into a 0–100 scale:
- 50 → price near fair value (rational zone)
- >75 → high irrationality, price stretched above fair value
- >90 → extreme irrationality, unsustainable extremes
- <25 → high irrationality, price stretched below fair value
- <10 → extreme bearish irrationality
4. Price vs Fair Value (% deviation)
The indicator plots the percentage difference between price and fair value:
pctDiff = (price - fairValue) / fairValue * 100
- Positive values → price above fair value (optimistic / overvalued)
- Negative values → price below fair value (pessimistic / undervalued)
Visuals:
- Irrationality Line (0–100) shows irrationality level.
- Fair Value (%) Plot: price deviation vs fair value (%), colored green above 0 and red below 0.
- Alerts: configurable thresholds for high and extreme irrationality.
How to read it:
- 50 → Market trading near fair value.
- >75 / >90 → Price may be irrationally high; risk of pullback increases.
- <25 / <10 → Price may be irrationally low; potential rebound zones, but trends can continue.
- Fair Value (%) plot → visual guide for % price stretch relative to fair value.
Notes / Warnings:
- Measures relative deviation, not fundamental value.
- High irrationality scores do not automatically indicate trades; markets can remain irrational longer than expected.
- Best used with other tools: momentum, volume, divergence, and multi-timeframe analysis.
오픈 소스 스크립트
트레이딩뷰의 진정한 정신에 따라, 이 스크립트의 작성자는 이를 오픈소스로 공개하여 트레이더들이 기능을 검토하고 검증할 수 있도록 했습니다. 작성자에게 찬사를 보냅니다! 이 코드는 무료로 사용할 수 있지만, 코드를 재게시하는 경우 하우스 룰이 적용된다는 점을 기억하세요.
면책사항
해당 정보와 게시물은 금융, 투자, 트레이딩 또는 기타 유형의 조언이나 권장 사항으로 간주되지 않으며, 트레이딩뷰에서 제공하거나 보증하는 것이 아닙니다. 자세한 내용은 이용 약관을 참조하세요.
오픈 소스 스크립트
트레이딩뷰의 진정한 정신에 따라, 이 스크립트의 작성자는 이를 오픈소스로 공개하여 트레이더들이 기능을 검토하고 검증할 수 있도록 했습니다. 작성자에게 찬사를 보냅니다! 이 코드는 무료로 사용할 수 있지만, 코드를 재게시하는 경우 하우스 룰이 적용된다는 점을 기억하세요.
면책사항
해당 정보와 게시물은 금융, 투자, 트레이딩 또는 기타 유형의 조언이나 권장 사항으로 간주되지 않으며, 트레이딩뷰에서 제공하거나 보증하는 것이 아닙니다. 자세한 내용은 이용 약관을 참조하세요.