OPEN-SOURCE SCRIPT
StratNinjaTable - Vertical
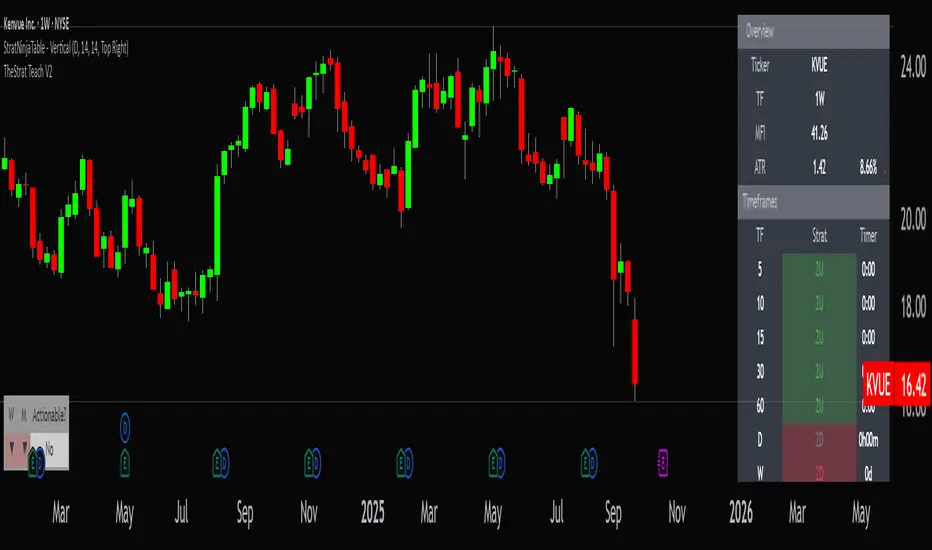
A Pine Script v6 indicator that displays a vertical table with key The Strat data and supporting metrics.
✦ Table Structure:
Overview:
Ticker – the stock symbol.
TF – the chart’s main timeframe.
MFI – Money Flow Index with selectable timeframe.
ATR – Average True Range with color coding:
Green – below 3%.
Yellow – between 3% and 6%.
Red – above 6%.
Timeframes:
Displayed vertically (5m, 15m, 1H, D, W, M, etc.).
Each shows the current bar type according to The Strat (1, 2U, 2D, 3).
Text color reflects candle direction (green = close above open, red = close below open).
Includes a countdown timer to bar close.
Fundamentals:
Market Cap – in billions.
Sector – stock sector.
SMA20 Δ – distance from the 20-period SMA (in %).
Avg Volume (30d) – average 30-day volume (in millions).
✦ Adjustments Made:
Removed the Strat Pattern section completely.
Removed the DIR column – direction is now represented by Strat cell text color.
Reordered Overview section: Ticker → TF → MFI → ATR.
ATR now has three levels of coloring (Green/Yellow/Red) for >3% and >6%
오픈 소스 스크립트
트레이딩뷰의 진정한 정신에 따라, 이 스크립트의 작성자는 이를 오픈소스로 공개하여 트레이더들이 기능을 검토하고 검증할 수 있도록 했습니다. 작성자에게 찬사를 보냅니다! 이 코드는 무료로 사용할 수 있지만, 코드를 재게시하는 경우 하우스 룰이 적용된다는 점을 기억하세요.
면책사항
해당 정보와 게시물은 금융, 투자, 트레이딩 또는 기타 유형의 조언이나 권장 사항으로 간주되지 않으며, 트레이딩뷰에서 제공하거나 보증하는 것이 아닙니다. 자세한 내용은 이용 약관을 참조하세요.
오픈 소스 스크립트
트레이딩뷰의 진정한 정신에 따라, 이 스크립트의 작성자는 이를 오픈소스로 공개하여 트레이더들이 기능을 검토하고 검증할 수 있도록 했습니다. 작성자에게 찬사를 보냅니다! 이 코드는 무료로 사용할 수 있지만, 코드를 재게시하는 경우 하우스 룰이 적용된다는 점을 기억하세요.
면책사항
해당 정보와 게시물은 금융, 투자, 트레이딩 또는 기타 유형의 조언이나 권장 사항으로 간주되지 않으며, 트레이딩뷰에서 제공하거나 보증하는 것이 아닙니다. 자세한 내용은 이용 약관을 참조하세요.