PROTECTED SOURCE SCRIPT
업데이트됨 Fundamental Strategy - anuragmundra
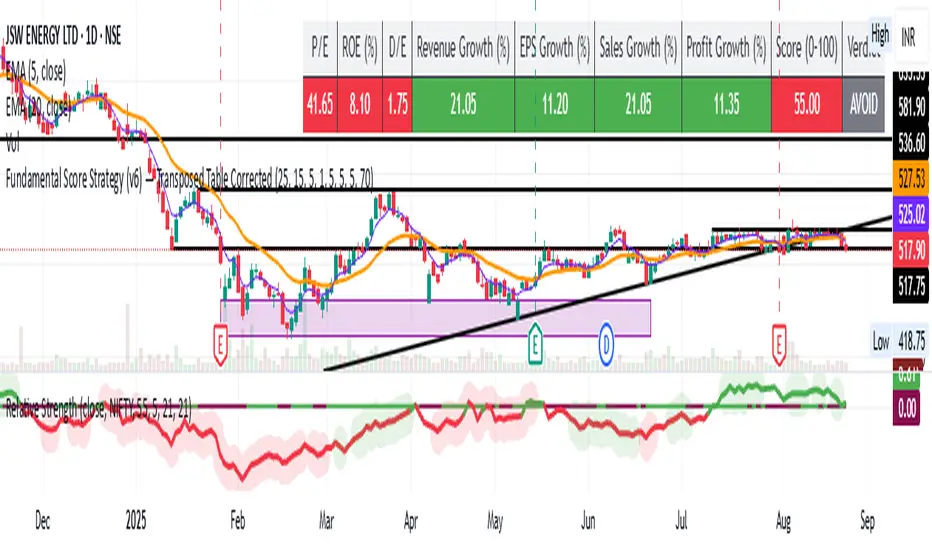
Fundamental Score Based Backtest
This strategy combines fundamental analysis with automated backtesting to help identify long-term investment opportunities. Instead of relying only on price action or technical indicators, it evaluates the financial health of a company and generates simulated BUY/SELL signals accordingly.
🔑 Key Parameters Considered:
Price-to-Earnings (P/E Ratio): Ensures the stock is not overpriced.
Return on Equity (ROE): Indicates efficiency of management and business profitability.
Debt-to-Equity Ratio (D/E): Evaluates leverage and financial risk.
Revenue Growth (YoY): Shows business expansion and demand.
EPS Growth: Reflects consistent profit generation for shareholders.
Sales Growth: Confirms topline improvement.
Profit Growth: Measures bottom-line strength.
✅ Buy Condition
When the fundamental score ≥ 70/100, the strategy enters a long position.
Score is based on meeting/exceeding thresholds for P/E, ROE, Revenue Growth, EPS Growth, Sales Growth, Profit Growth, and Debt-to-Equity.
❌ Sell/Exit Condition
When the score falls below 70, the position is closed.
⚡ How to Use
Designed for medium to long-term investors who prefer fundamentally strong companies.
Can be run in the Strategy Tester to evaluate the historical performance of any stock.
Suitable as a stock-picking filter rather than a short-term trading system.
📊 Notes
Some ratios (like ROE) are based on annual values (FY), while others (EPS, Revenue, Net Income) use TTM for recency.
Not all symbols/exchanges provide full fundamental data. If data is missing, some metrics may show as N/A.
⚠️ Disclaimer: This is an educational tool for research and backtesting only. It is not financial advice. Always combine with your own due diligence before making investment decisions.
릴리즈 노트
Updated Overlay = true릴리즈 노트
Updated the table data and direction릴리즈 노트
Updated table color and symbol read logic보호된 스크립트입니다
이 스크립트는 비공개 소스로 게시됩니다. 하지만 이를 자유롭게 제한 없이 사용할 수 있습니다 – 자세한 내용은 여기에서 확인하세요.
면책사항
해당 정보와 게시물은 금융, 투자, 트레이딩 또는 기타 유형의 조언이나 권장 사항으로 간주되지 않으며, 트레이딩뷰에서 제공하거나 보증하는 것이 아닙니다. 자세한 내용은 이용 약관을 참조하세요.
보호된 스크립트입니다
이 스크립트는 비공개 소스로 게시됩니다. 하지만 이를 자유롭게 제한 없이 사용할 수 있습니다 – 자세한 내용은 여기에서 확인하세요.
면책사항
해당 정보와 게시물은 금융, 투자, 트레이딩 또는 기타 유형의 조언이나 권장 사항으로 간주되지 않으며, 트레이딩뷰에서 제공하거나 보증하는 것이 아닙니다. 자세한 내용은 이용 약관을 참조하세요.