OPEN-SOURCE SCRIPT
업데이트됨 Earnings Day - Price Predictor [DunesIsland]
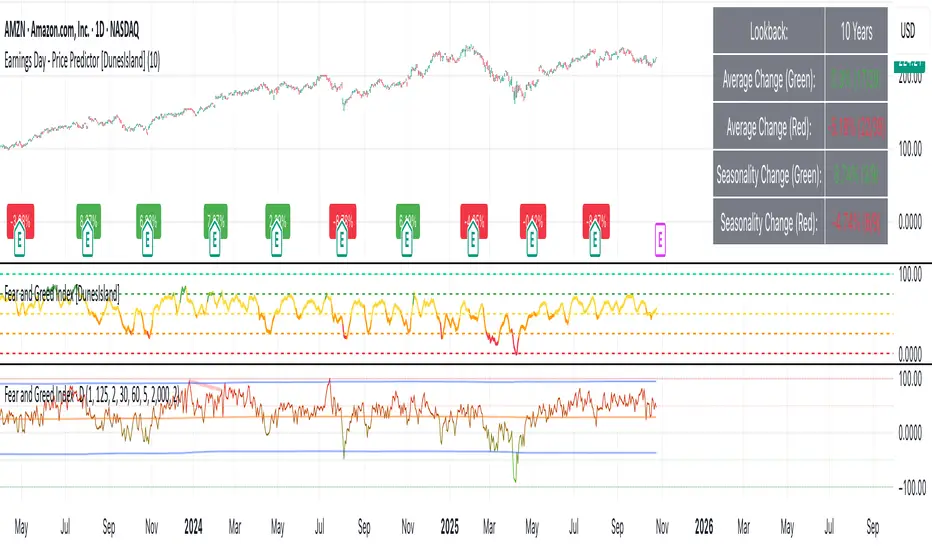
It's designed to analyze and visualize historical stock price movements on earnings report days, focusing on percentage changes.
Here's a breakdown of what it does, step by step:
Key Inputs and Setup
Processing and Calculations (on the Last Bar)
Overall Averages:
Seasonality (Next Quarter Prediction):
Visual Outputs
Purpose and Usage
This indicator helps traders assess a stock's historical reaction to earnings announcements. The overall averages give a broad sense of typical gains/losses, while the seasonality focuses on quarter-specific trends to "predict" potential movement for the upcoming earnings (based on past same-quarter performance). It's best used on daily charts for stocks with reliable earnings data. Note that quarter inference is calendar-based and may not perfectly match fiscal calendars for all companies—it's an approximation.
Here's a breakdown of what it does, step by step:
Key Inputs and Setup
- User Input: There's a single input for "Lookback Years" (default: 10), which determines how far back in time (approximately) the indicator analyzes earnings data. It uses a rough calculation of milliseconds in that period to filter historical data.
- Data Fetching: It uses TradingView's request.earnings function to pull actual earnings per share (EPS) data for the current ticker. Earnings days are identified where EPS data exists on a bar but not on the previous one (to avoid duplicates).
- Price Change Calculation: For each detected earnings day, it computes the percentage price movement as (close - close[1]) / close[1] * 100, representing the change from the previous close to the current close on that day.
Processing and Calculations (on the Last Bar)
- Lookback Filter: It calculates a cutoff timestamp for the lookback period and processes only earnings events within that window.
Overall Averages:
- Separates positive (≥0%) and negative (<0%) percentage changes.
Seasonality (Next Quarter Prediction):
- Identifies the most recent earnings quarter (latest_q).
- Predicts the "next" quarter (e.g., if latest is Q4, next is Q1;
- Again, separates positive and negative changes, computing their respective averages.
Visual Outputs
- Lookback: How far to fetch the data in years.
- Average Change (Green): Showing the average of all positive changes.
- Average Change (Red): Showing the average of all negative changes.
- Seasonality Change (Green): Showing the average of positive changes for the predicted next quarter.
- Seasonality Change (Red): Showing the average of negative changes for the predicted next quarter.
Purpose and Usage
This indicator helps traders assess a stock's historical reaction to earnings announcements. The overall averages give a broad sense of typical gains/losses, while the seasonality focuses on quarter-specific trends to "predict" potential movement for the upcoming earnings (based on past same-quarter performance). It's best used on daily charts for stocks with reliable earnings data. Note that quarter inference is calendar-based and may not perfectly match fiscal calendars for all companies—it's an approximation.
릴리즈 노트
This update enhances the display table by adding count breakdowns for positive and negative changes, providing more context on the frequency of gains/losses:- Average Change (Green/Red): Now shows the average % alongside "(positives/total)" or "(negatives/total)" (e.g., "5.23% (4/12)" means 4 positive changes out of 12 total earnings days in the lookback).
- Seasonality Change (Green/Red): Similarly updated to include "(positives/total)" or "(negatives/total)" for the predicted next quarter, plus the quarter label (e.g., "3.45% (1/3)").
오픈 소스 스크립트
트레이딩뷰의 진정한 정신에 따라, 이 스크립트의 작성자는 이를 오픈소스로 공개하여 트레이더들이 기능을 검토하고 검증할 수 있도록 했습니다. 작성자에게 찬사를 보냅니다! 이 코드는 무료로 사용할 수 있지만, 코드를 재게시하는 경우 하우스 룰이 적용된다는 점을 기억하세요.
면책사항
해당 정보와 게시물은 금융, 투자, 트레이딩 또는 기타 유형의 조언이나 권장 사항으로 간주되지 않으며, 트레이딩뷰에서 제공하거나 보증하는 것이 아닙니다. 자세한 내용은 이용 약관을 참조하세요.
오픈 소스 스크립트
트레이딩뷰의 진정한 정신에 따라, 이 스크립트의 작성자는 이를 오픈소스로 공개하여 트레이더들이 기능을 검토하고 검증할 수 있도록 했습니다. 작성자에게 찬사를 보냅니다! 이 코드는 무료로 사용할 수 있지만, 코드를 재게시하는 경우 하우스 룰이 적용된다는 점을 기억하세요.
면책사항
해당 정보와 게시물은 금융, 투자, 트레이딩 또는 기타 유형의 조언이나 권장 사항으로 간주되지 않으며, 트레이딩뷰에서 제공하거나 보증하는 것이 아닙니다. 자세한 내용은 이용 약관을 참조하세요.