OPEN-SOURCE SCRIPT
The Strat Candle State Table (Two Symbols)
The Strat Candle State Table (Two Symbols) – Multi-Timeframe Analysis
This advanced indicator is designed for traders who follow The Strat methodology, providing a quick, clear, and actionable view of candle states across two selected symbols and a chosen timeframe. It allows you to seamlessly integrate multi-symbol analysis into your trading, offering real-time insights into price action and market momentum based on **The Strat’s** powerful principles.
What It Does:
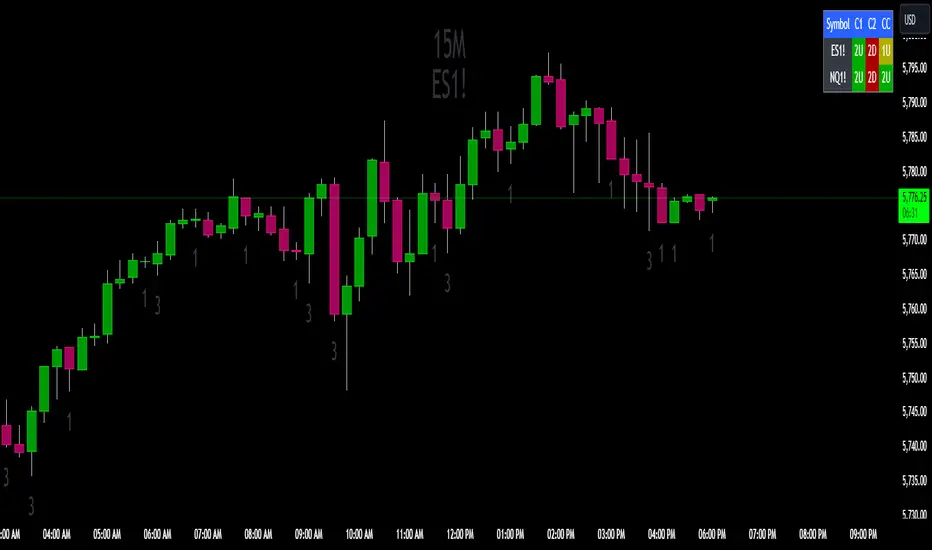
For each selected symbol, the indicator retrieves and analyzes the price data for three candles:
- Candle 1 (C1): The third candle from the current one.
- Candle 2 (C2): The candle directly before the current one (previous candle).
- Current Candle (CC): The live candle, which is still forming.
Using this information, it plots the Scenario 1 (Inside Bar), Scenario 2 (Directional), and **Scenario 3 (Outside Bar)** states for each candle, color-coding them to help you quickly assess market conditions and price action.
Strat Candle States:
- Scenario 1 (Inside Bar): The candle stays within the high and low of the previous candle (indicating consolidation or indecision).
- Scenario 2 (Directional)* The candle breaks either the high (2-up) or low (2-down) of the previous candle, indicating potential continuation in that direction.
- Scenario 3 (Outside Bar): The candle breaks both the high and low of the previous candle, signaling increased volatility and a potential reversal.
Customizable Color Scheme:
The default colors follow these settings (but can be changed to your preference):
- 1U (Inside and Up): Yellow (indicating an inside bar that closed higher).
- 1D (Inside and Down): Orange (indicating an inside bar that closed lower).
- 2U (Two Up): Green if the candle closes higher, Red if the candle closes lower (conflict).
- 2D (Two Down): Red if the candle closes lower, Green if the candle closes higher (conflict).
- 3U (Three Up): Lighter Purple.
- 3D (Three Down): Darker Purple/Magenta.
Each state is dynamically updated based on the actual price action and whether the candle closes above or below the open. Conflict candles (like a 2-up closing red or 2-down closing green) are highlighted, making it easier to spot potential reversals or weakness in the trend.
Timeframe Flexibility:
You can overlay this indicator on any chart regardless of the timeframe. The key is to select the timeframe you want the indicator to plot for when setting up. Whether you're working on a 5-minute chart, daily, or even weekly, the indicator will analyze the candles according to the selected timeframe, giving you the versatility to adapt it to various trading strategies.
Powerful Use Cases:
1. Multi-Symbol Analysis in Real-Time: The Strat Candle State Table displays the candle states for two symbols at once, helping you track multiple instruments without switching charts. This is extremely useful when monitoring correlated assets like SPY and QQQ, or sector-related pairs such as DIA and IWM
2. Seamless Top-Down View: By analyzing the three most recent candles (C1, C2, and the current candle), the indicator allows you to maintain a top-down perspective on price action, spotting setups early and tracking candle state changes across different symbols and timeframes.
3. Enhanced Conflict Detection: The background shading automatically adjusts for conflict candles, such as a 2-up that closes red or a 2-down that closes green. This provides a quick visual cue to warn you when the current trend may be weakening or reversing.
4. Trade Execution Precision: With this table providing constant feedback on price action and candle state, traders can more easily time their entries and exits, whether they are looking for reversals or continuations
5. Focus on Timeframe Continuity: Use this indicator to stay in alignment with The Strat's Timeframe Continuity, ensuring you are trading in the direction of the most aligned candles, across both symbols. This allows for more precise trade management and higher-probability setups.
6. Customizable to Your Strategy: Change the color coding and candle states to match your personal preferences or trading strategy, making this indicator adaptable to your specific needs.
Most Powerful Use Case – Simultaneous Break Detection:
The Strat Candle State Table shines in setups where simultaneous breaks are being monitored across multiple symbols. For example, if both symbols trigger a 2-up or 3-up at the same time, this confirms that momentum is flowing in the same direction for multiple instruments, giving you stronger trade conviction.
By seeing real-time data for two key symbols, you can ensure that you're catching simultaneous breaks, where multiple instruments are signaling the same move. This can be especially effective in index-based trading, where the strength or weakness of multiple sectors or assets must align for a higher probability of success
This advanced indicator is designed for traders who follow The Strat methodology, providing a quick, clear, and actionable view of candle states across two selected symbols and a chosen timeframe. It allows you to seamlessly integrate multi-symbol analysis into your trading, offering real-time insights into price action and market momentum based on **The Strat’s** powerful principles.
What It Does:
For each selected symbol, the indicator retrieves and analyzes the price data for three candles:
- Candle 1 (C1): The third candle from the current one.
- Candle 2 (C2): The candle directly before the current one (previous candle).
- Current Candle (CC): The live candle, which is still forming.
Using this information, it plots the Scenario 1 (Inside Bar), Scenario 2 (Directional), and **Scenario 3 (Outside Bar)** states for each candle, color-coding them to help you quickly assess market conditions and price action.
Strat Candle States:
- Scenario 1 (Inside Bar): The candle stays within the high and low of the previous candle (indicating consolidation or indecision).
- Scenario 2 (Directional)* The candle breaks either the high (2-up) or low (2-down) of the previous candle, indicating potential continuation in that direction.
- Scenario 3 (Outside Bar): The candle breaks both the high and low of the previous candle, signaling increased volatility and a potential reversal.
Customizable Color Scheme:
The default colors follow these settings (but can be changed to your preference):
- 1U (Inside and Up): Yellow (indicating an inside bar that closed higher).
- 1D (Inside and Down): Orange (indicating an inside bar that closed lower).
- 2U (Two Up): Green if the candle closes higher, Red if the candle closes lower (conflict).
- 2D (Two Down): Red if the candle closes lower, Green if the candle closes higher (conflict).
- 3U (Three Up): Lighter Purple.
- 3D (Three Down): Darker Purple/Magenta.
Each state is dynamically updated based on the actual price action and whether the candle closes above or below the open. Conflict candles (like a 2-up closing red or 2-down closing green) are highlighted, making it easier to spot potential reversals or weakness in the trend.
Timeframe Flexibility:
You can overlay this indicator on any chart regardless of the timeframe. The key is to select the timeframe you want the indicator to plot for when setting up. Whether you're working on a 5-minute chart, daily, or even weekly, the indicator will analyze the candles according to the selected timeframe, giving you the versatility to adapt it to various trading strategies.
Powerful Use Cases:
1. Multi-Symbol Analysis in Real-Time: The Strat Candle State Table displays the candle states for two symbols at once, helping you track multiple instruments without switching charts. This is extremely useful when monitoring correlated assets like SPY and QQQ, or sector-related pairs such as DIA and IWM
2. Seamless Top-Down View: By analyzing the three most recent candles (C1, C2, and the current candle), the indicator allows you to maintain a top-down perspective on price action, spotting setups early and tracking candle state changes across different symbols and timeframes.
3. Enhanced Conflict Detection: The background shading automatically adjusts for conflict candles, such as a 2-up that closes red or a 2-down that closes green. This provides a quick visual cue to warn you when the current trend may be weakening or reversing.
4. Trade Execution Precision: With this table providing constant feedback on price action and candle state, traders can more easily time their entries and exits, whether they are looking for reversals or continuations
5. Focus on Timeframe Continuity: Use this indicator to stay in alignment with The Strat's Timeframe Continuity, ensuring you are trading in the direction of the most aligned candles, across both symbols. This allows for more precise trade management and higher-probability setups.
6. Customizable to Your Strategy: Change the color coding and candle states to match your personal preferences or trading strategy, making this indicator adaptable to your specific needs.
Most Powerful Use Case – Simultaneous Break Detection:
The Strat Candle State Table shines in setups where simultaneous breaks are being monitored across multiple symbols. For example, if both symbols trigger a 2-up or 3-up at the same time, this confirms that momentum is flowing in the same direction for multiple instruments, giving you stronger trade conviction.
By seeing real-time data for two key symbols, you can ensure that you're catching simultaneous breaks, where multiple instruments are signaling the same move. This can be especially effective in index-based trading, where the strength or weakness of multiple sectors or assets must align for a higher probability of success
오픈 소스 스크립트
트레이딩뷰의 진정한 정신에 따라, 이 스크립트의 작성자는 이를 오픈소스로 공개하여 트레이더들이 기능을 검토하고 검증할 수 있도록 했습니다. 작성자에게 찬사를 보냅니다! 이 코드는 무료로 사용할 수 있지만, 코드를 재게시하는 경우 하우스 룰이 적용된다는 점을 기억하세요.
면책사항
해당 정보와 게시물은 금융, 투자, 트레이딩 또는 기타 유형의 조언이나 권장 사항으로 간주되지 않으며, 트레이딩뷰에서 제공하거나 보증하는 것이 아닙니다. 자세한 내용은 이용 약관을 참조하세요.
오픈 소스 스크립트
트레이딩뷰의 진정한 정신에 따라, 이 스크립트의 작성자는 이를 오픈소스로 공개하여 트레이더들이 기능을 검토하고 검증할 수 있도록 했습니다. 작성자에게 찬사를 보냅니다! 이 코드는 무료로 사용할 수 있지만, 코드를 재게시하는 경우 하우스 룰이 적용된다는 점을 기억하세요.
면책사항
해당 정보와 게시물은 금융, 투자, 트레이딩 또는 기타 유형의 조언이나 권장 사항으로 간주되지 않으며, 트레이딩뷰에서 제공하거나 보증하는 것이 아닙니다. 자세한 내용은 이용 약관을 참조하세요.