PROTECTED SOURCE SCRIPT
업데이트됨 YUSUF LOG 1.deneme
This indicator integrates multiple data points and uses them together to generate auxiliary buy or sell signals. It relies on volume, overbought/oversold signals, and moving averages. It should not be used alone but rather as part of a broader strategy to aid in decision-making.
릴리즈 노트
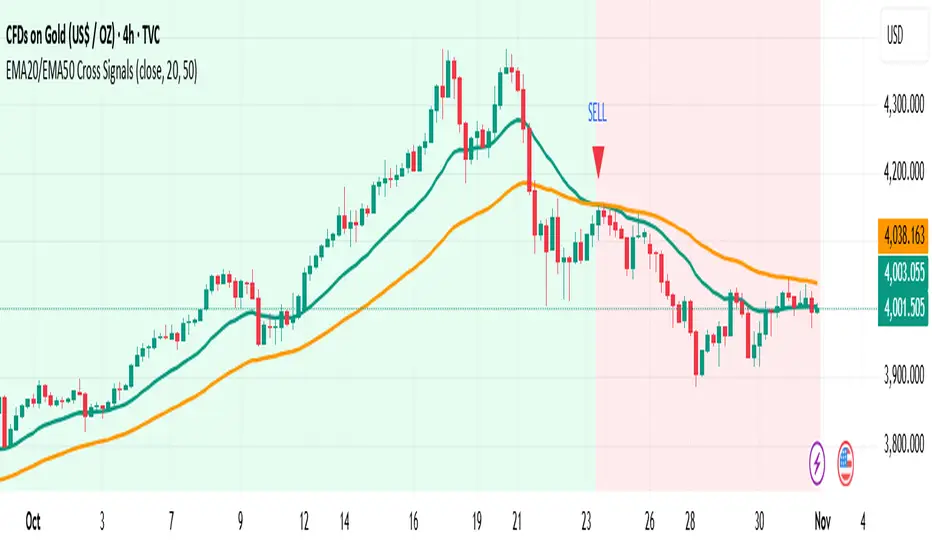
What it doesGenerates BUY and SELL signals when the EMA 20 crosses the EMA 50. It plots both EMAs, paints background by trend, and can trigger TradingView alerts.
How it works
BUY: when EMA20 crosses above EMA50.
SELL: when EMA20 crosses below EMA50.
Optional confirmation requires the candle close to be above/below both EMAs to reduce whipsaws.
Inputs
Source: price source (default: close).
Fast EMA / Slow EMA: default 20 / 50, fully adjustable.
Require close confirm: on/off filter for stronger signals.
Color background by trend: visual trend context.
Visuals & Alerts
Plots EMA20 and EMA50.
Draws upward/downward triangles for Buy/Sell signals.
Two alert conditions: BUY (EMA20 x EMA50 Up) and SELL (EMA20 x EMA50 Down).
Best practices
Use higher timeframes (e.g., H1/H4) or enable confirmation to reduce noise.
Combine with support/resistance and volume for better entries and exits.
Consider ATR-based stops and partial take-profits around recent structure levels.
보호된 스크립트입니다
이 스크립트는 비공개 소스로 게시됩니다. 하지만 이를 자유롭게 제한 없이 사용할 수 있습니다 – 자세한 내용은 여기에서 확인하세요.
면책사항
해당 정보와 게시물은 금융, 투자, 트레이딩 또는 기타 유형의 조언이나 권장 사항으로 간주되지 않으며, 트레이딩뷰에서 제공하거나 보증하는 것이 아닙니다. 자세한 내용은 이용 약관을 참조하세요.
보호된 스크립트입니다
이 스크립트는 비공개 소스로 게시됩니다. 하지만 이를 자유롭게 제한 없이 사용할 수 있습니다 – 자세한 내용은 여기에서 확인하세요.
면책사항
해당 정보와 게시물은 금융, 투자, 트레이딩 또는 기타 유형의 조언이나 권장 사항으로 간주되지 않으며, 트레이딩뷰에서 제공하거나 보증하는 것이 아닙니다. 자세한 내용은 이용 약관을 참조하세요.