PROTECTED SOURCE SCRIPT
Wüsten
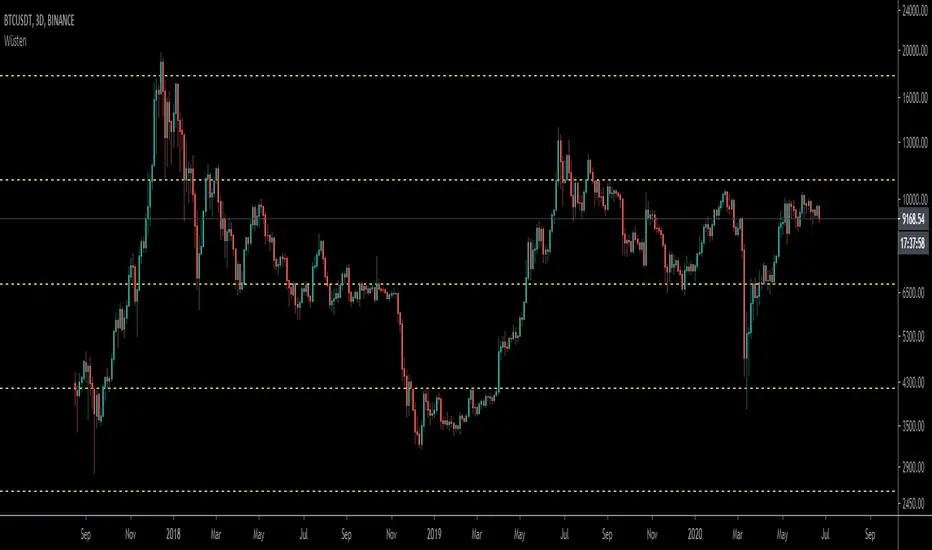
Plots Fibonacci Levels Automatically
Instruction to add it:
1) Click Below Right button: ADD TO FAVORITE SCRIPTS.
2) On your chart, click Indicators, search for Wusten
3) Once added on left go to settings.... Leave INPUT tab, click STYLE tab.
4) UN-TICK ALL PLOT boxes.
5) Scroll all the way down and at the very bottom left click DEFAULTS, and click SAVE AS DEFAULT.
(if you DON'T un-tick all PLOT boxes it draws another line on top of the dashed line for some reason).
6) The color should be as close to the one you wanted.
If not take time and correct the colors on the STYLE tab BUT remember to always go and click SAVE AS DEFAULT when done.
Then your colors will always stay like that.
보호된 스크립트입니다
이 스크립트는 비공개 소스로 게시됩니다. 하지만 이를 자유롭게 제한 없이 사용할 수 있습니다 – 자세한 내용은 여기에서 확인하세요.
면책사항
해당 정보와 게시물은 금융, 투자, 트레이딩 또는 기타 유형의 조언이나 권장 사항으로 간주되지 않으며, 트레이딩뷰에서 제공하거나 보증하는 것이 아닙니다. 자세한 내용은 이용 약관을 참조하세요.
면책사항
해당 정보와 게시물은 금융, 투자, 트레이딩 또는 기타 유형의 조언이나 권장 사항으로 간주되지 않으며, 트레이딩뷰에서 제공하거나 보증하는 것이 아닙니다. 자세한 내용은 이용 약관을 참조하세요.