OPEN-SOURCE SCRIPT
업데이트됨 Moving Average Crossover Histogram Indicator
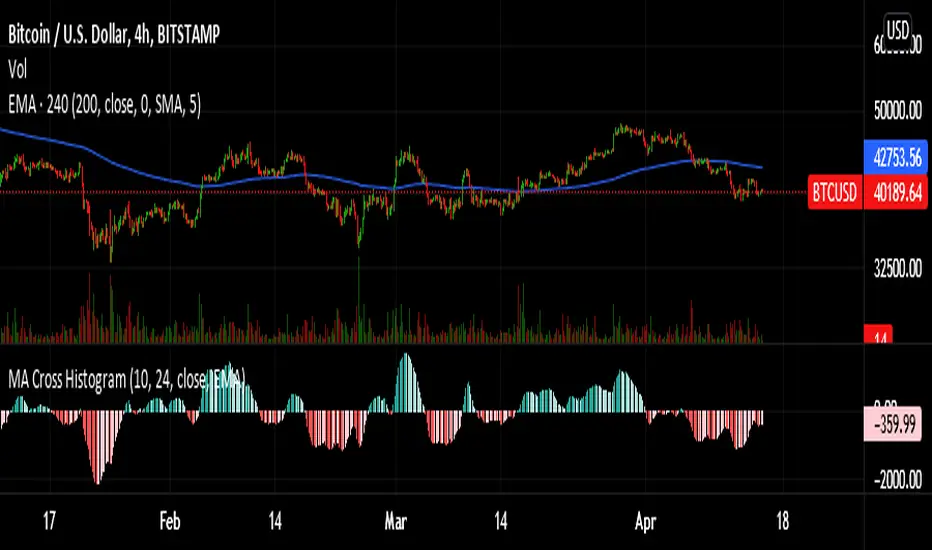
A modified version of the MACD indicator. As its name suggests, this is a moving average crossover indicator but the difference in values between moving averages is represented by a histogram. It subtracts the value of a fast MA and slow MA then the result is represented in a histogram which makes it easier for you to identify and visualize every moving average crossover.
If you use moving average crossover as your buy/sell signal this indicator is for you.
You could use this indicator instead of using two moving averages on your main chart. Really convenient, easy to use, and make your chart clutter-free. You could set the fast and slow MA values also the moving average types according to your trading style.
Hope you like it. :)
릴리즈 노트
Added and edited some line of code so that both of the moving average mode can be changed independently.오픈 소스 스크립트
트레이딩뷰의 진정한 정신에 따라, 이 스크립트의 작성자는 이를 오픈소스로 공개하여 트레이더들이 기능을 검토하고 검증할 수 있도록 했습니다. 작성자에게 찬사를 보냅니다! 이 코드는 무료로 사용할 수 있지만, 코드를 재게시하는 경우 하우스 룰이 적용된다는 점을 기억하세요.
면책사항
해당 정보와 게시물은 금융, 투자, 트레이딩 또는 기타 유형의 조언이나 권장 사항으로 간주되지 않으며, 트레이딩뷰에서 제공하거나 보증하는 것이 아닙니다. 자세한 내용은 이용 약관을 참조하세요.
오픈 소스 스크립트
트레이딩뷰의 진정한 정신에 따라, 이 스크립트의 작성자는 이를 오픈소스로 공개하여 트레이더들이 기능을 검토하고 검증할 수 있도록 했습니다. 작성자에게 찬사를 보냅니다! 이 코드는 무료로 사용할 수 있지만, 코드를 재게시하는 경우 하우스 룰이 적용된다는 점을 기억하세요.
면책사항
해당 정보와 게시물은 금융, 투자, 트레이딩 또는 기타 유형의 조언이나 권장 사항으로 간주되지 않으며, 트레이딩뷰에서 제공하거나 보증하는 것이 아닙니다. 자세한 내용은 이용 약관을 참조하세요.