INVITE-ONLY SCRIPT
Wave Master Pro
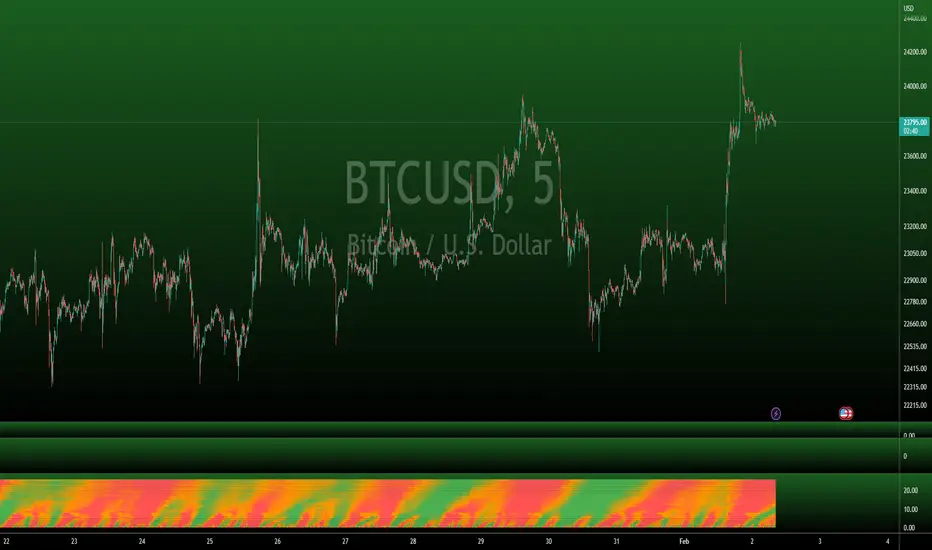
This indicator is built on Stochastics and uses multiple timeframes to give you a heatmap style view of where overbought and oversold levels are across 25 different timeframes.
Here's a few things you'll want to watch out for when using this indicator:
OVERBOUGHT
When a wave goes into overbought or is approaching overbought, you'll notice the heatmap transitioning from orange to red. Probably wise to move up stop losses or close the position out, especially when the entire vertical time slot is completely red.
OVERSOLD
Opposite of overbought, when a wave goes into oversold, the heatmap will transition from orange to green. This could be a good place to close out short positions or be on the lookout for long positions. Again, especially when the entire vertical time slot is completely green.
TIMEFRAMES
This indicator is dynamic in that it will automatically adjust the heatmap timefrmaes as you change the timeframe of your chart.
LIMITATIONS
Due to there being so many different timeframes that are utilized in this indicator, you will find that this indicator works best on 1H timeframes or lower, but it will work up to 4H timeframes. Currently, anything above 4H is not optimal for this indicator. I would recommend using the regular Wave Master indicator if you like using high timeframes.
OTHER USEFUL INFORMATION
This is a vidual aid in determining when many timeframes approach and reach extended levels based on the configuration of the Stochastics that we have found to be most optimal, especially in lower timeframes. It is wise to refer back to the Wave Master indicator for a raw view of the waves.
초대 전용 스크립트
이 스크립트는 작성자가 승인한 사용자만 접근할 수 있습니다. 사용하려면 요청 후 승인을 받아야 하며, 일반적으로 결제 후에 허가가 부여됩니다. 자세한 내용은 아래 작성자의 안내를 따르거나 bitdoctor에게 직접 문의하세요.
트레이딩뷰는 스크립트의 작동 방식을 충분히 이해하고 작성자를 완전히 신뢰하지 않는 이상, 해당 스크립트에 비용을 지불하거나 사용하는 것을 권장하지 않습니다. 커뮤니티 스크립트에서 무료 오픈소스 대안을 찾아보실 수도 있습니다.
작성자 지시 사항
Please send a DM if you would like access or visit our website for more details.
CE - BitDoctor
Access our private indicators and join our Premium Room: bitdoctor.org
Beware of scams - I'll never DM you asking for funds.
Access our private indicators and join our Premium Room: bitdoctor.org
Beware of scams - I'll never DM you asking for funds.
면책사항
해당 정보와 게시물은 금융, 투자, 트레이딩 또는 기타 유형의 조언이나 권장 사항으로 간주되지 않으며, 트레이딩뷰에서 제공하거나 보증하는 것이 아닙니다. 자세한 내용은 이용 약관을 참조하세요.