OPEN-SOURCE SCRIPT
Anchored BTC

Introduce
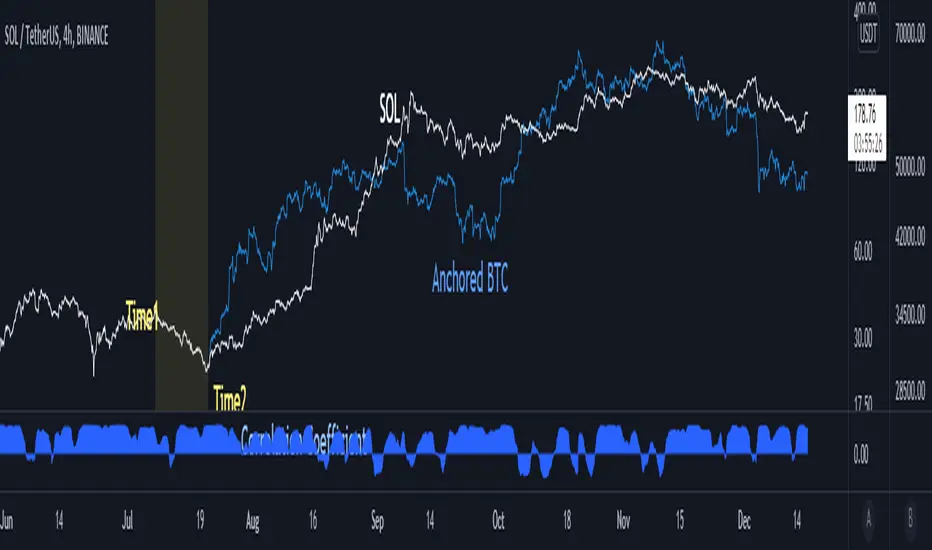
When looking at altcoins and bitcoins together and seeing coupling and decoupling, we add a bitcoin chart in the "Compare" tab.
We checked where the coupling occurs in "Auto" mode, but if we move the chart, the overlapped position will change.
So I created the “Anchored BTC” indicator, which made the Bitcoin chart immovable.
How to use
First, add a bitcoin chart in the "Compare" tab and compare it with the altcoin chart.
And add the "Correlation Coefficient" built-in indicator to find the part where the correlation coefficient is 0.8 or higher.(it means finding well coupled part)
Among them, set the swing high or swing low part to Time1 and Time2.
Check if it looks the same as the existing BTC chart and you are done.
소개
알트코인과 비트코인을 함께 보며 커플링과 디커플링을 볼 때 우리는 비교 탭에서 비트코인 차트를 추가하여 봅니다.
"오토" 모드로 어느 부분에서 커플링이 일어나는지 체크했는데 차트를 옮기면 겹쳐놓아졌던 위치가 달라지게됩니다.
그래서 "Anchored BTC" 지표를 만들어, 비트코인 차트가 움직이지 못하게 만들었습니다.
사용법
우선 비교탭에서 비트코인차트를 추가하여 알트코인 차트와 비교해봅니다.
그리고 "상관계수" 빌트인 지표를 추가하여 상관계수가 0.8이상인 부분을 찾습니다.(커플링한 부분을 찾는겁니다)
이 중에서 스윙하이나 스윙로우인 부분을 Time1, Time2로 맞춰줍니다.
기존의 BTC차트와 동일하게 보여지는지 확인하면 끝납니다.
오픈 소스 스크립트
트레이딩뷰의 진정한 정신에 따라, 이 스크립트의 작성자는 이를 오픈소스로 공개하여 트레이더들이 기능을 검토하고 검증할 수 있도록 했습니다. 작성자에게 찬사를 보냅니다! 이 코드는 무료로 사용할 수 있지만, 코드를 재게시하는 경우 하우스 룰이 적용된다는 점을 기억하세요.
면책사항
해당 정보와 게시물은 금융, 투자, 트레이딩 또는 기타 유형의 조언이나 권장 사항으로 간주되지 않으며, 트레이딩뷰에서 제공하거나 보증하는 것이 아닙니다. 자세한 내용은 이용 약관을 참조하세요.
오픈 소스 스크립트
트레이딩뷰의 진정한 정신에 따라, 이 스크립트의 작성자는 이를 오픈소스로 공개하여 트레이더들이 기능을 검토하고 검증할 수 있도록 했습니다. 작성자에게 찬사를 보냅니다! 이 코드는 무료로 사용할 수 있지만, 코드를 재게시하는 경우 하우스 룰이 적용된다는 점을 기억하세요.
면책사항
해당 정보와 게시물은 금융, 투자, 트레이딩 또는 기타 유형의 조언이나 권장 사항으로 간주되지 않으며, 트레이딩뷰에서 제공하거나 보증하는 것이 아닙니다. 자세한 내용은 이용 약관을 참조하세요.