OPEN-SOURCE SCRIPT
1% Range Bars with Sequence Table
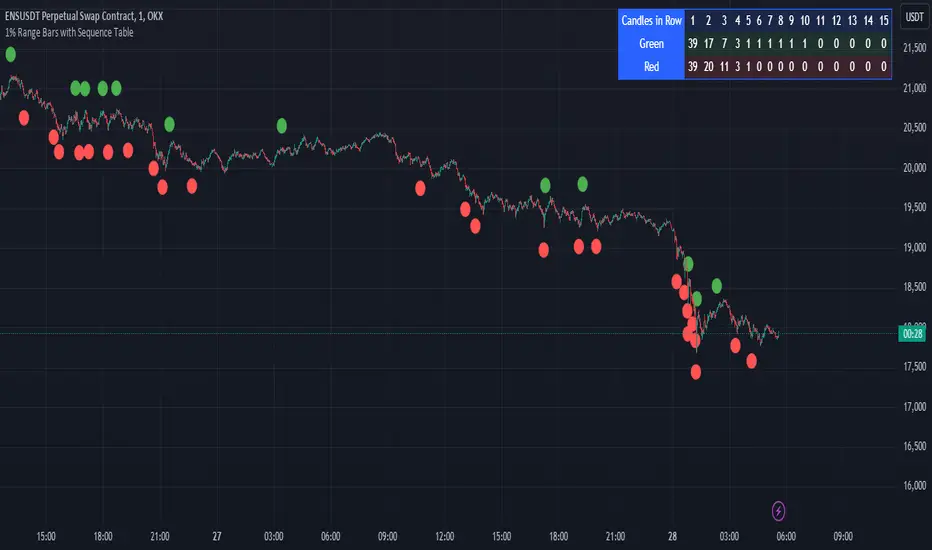
Overall Logic:
The script is designed to help traders visualize and analyze price movements on the chart, where each 1% movement is highlighted with a corresponding symbol. Additionally, the table helps track and analyze the number and length of consecutive price movements in one direction, which can be useful for identifying trends and understanding market dynamics.
This script can be particularly useful for traders looking for recurring patterns in price movements and wanting to quickly identify significant changes on the chart.
Main elements of the script:
Price Percentage Change:
The script tracks the price movement by 1% from the last significant value (the value at which the last 1% change was recorded).
If the price rises by 1% or more, a green circle is displayed above the bar.
If the price drops by 1% or more, a red circle is displayed below the bar.
Sequence Counting:
The script counts the number of consecutive 1% moves upwards (green circles) and downwards (red circles).
Separate counters are maintained for upward and downward movements, increasing each time the respective movement occurs.
If an opposite movement interrupts the sequence, the counter for the opposite direction is reset.
Sequence Table:
A table displayed on the chart shows the number of sequences of 1% movements in one direction for lengths from 1 to 15 bars.
The table is updated in real-time and shows how many times sequences of a certain length occurred on the chart, where the price moved by 1% in one direction.
오픈 소스 스크립트
트레이딩뷰의 진정한 정신에 따라, 이 스크립트의 작성자는 이를 오픈소스로 공개하여 트레이더들이 기능을 검토하고 검증할 수 있도록 했습니다. 작성자에게 찬사를 보냅니다! 이 코드는 무료로 사용할 수 있지만, 코드를 재게시하는 경우 하우스 룰이 적용된다는 점을 기억하세요.
면책사항
해당 정보와 게시물은 금융, 투자, 트레이딩 또는 기타 유형의 조언이나 권장 사항으로 간주되지 않으며, 트레이딩뷰에서 제공하거나 보증하는 것이 아닙니다. 자세한 내용은 이용 약관을 참조하세요.
오픈 소스 스크립트
트레이딩뷰의 진정한 정신에 따라, 이 스크립트의 작성자는 이를 오픈소스로 공개하여 트레이더들이 기능을 검토하고 검증할 수 있도록 했습니다. 작성자에게 찬사를 보냅니다! 이 코드는 무료로 사용할 수 있지만, 코드를 재게시하는 경우 하우스 룰이 적용된다는 점을 기억하세요.
면책사항
해당 정보와 게시물은 금융, 투자, 트레이딩 또는 기타 유형의 조언이나 권장 사항으로 간주되지 않으며, 트레이딩뷰에서 제공하거나 보증하는 것이 아닙니다. 자세한 내용은 이용 약관을 참조하세요.