OPEN-SOURCE SCRIPT
Tycoon Gann

Currently this script will work for the stocks and futures price trading in between 1000 - 100000. In our future update we will add another feature that will give you access to all the price digit stocks futures and currencies too .
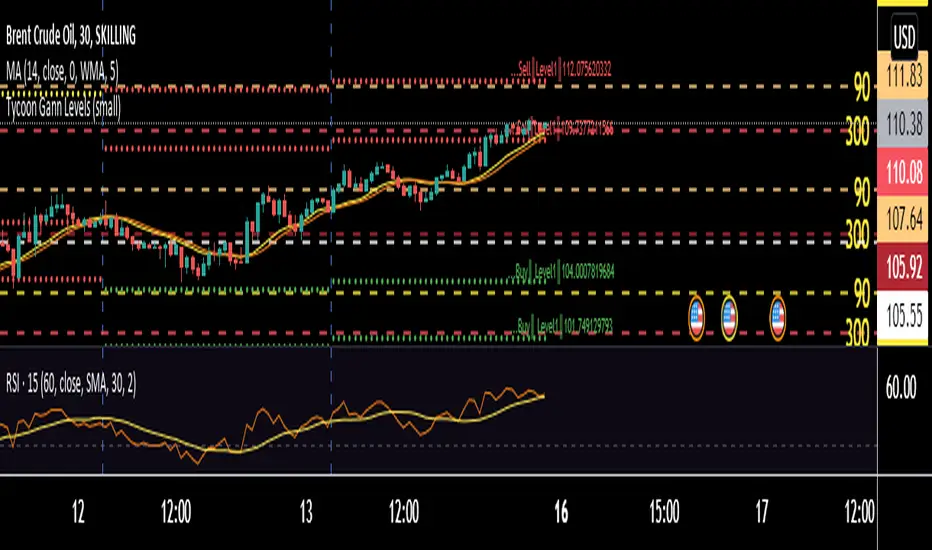
This is purely based on a secret method of Tycoon Infotek as a research of GANN levels we found in our experience these WD GANN Trend angle based calculations giving us some important hints to watch . Degree offset from previous close price add 90 degree to calculate resistance and substract 90 to get resistance levels . green color dots denotes buying pressure zone and red color denotes selling pressure zones . yellow line indicates neutral sign
These levels not only shows us the Support and resistance . It clearly intimate us the strength of selling and buying pressure naturally occurred once the price reaches the zones.
오픈 소스 스크립트
트레이딩뷰의 진정한 정신에 따라, 이 스크립트의 작성자는 이를 오픈소스로 공개하여 트레이더들이 기능을 검토하고 검증할 수 있도록 했습니다. 작성자에게 찬사를 보냅니다! 이 코드는 무료로 사용할 수 있지만, 코드를 재게시하는 경우 하우스 룰이 적용된다는 점을 기억하세요.
면책사항
해당 정보와 게시물은 금융, 투자, 트레이딩 또는 기타 유형의 조언이나 권장 사항으로 간주되지 않으며, 트레이딩뷰에서 제공하거나 보증하는 것이 아닙니다. 자세한 내용은 이용 약관을 참조하세요.
오픈 소스 스크립트
트레이딩뷰의 진정한 정신에 따라, 이 스크립트의 작성자는 이를 오픈소스로 공개하여 트레이더들이 기능을 검토하고 검증할 수 있도록 했습니다. 작성자에게 찬사를 보냅니다! 이 코드는 무료로 사용할 수 있지만, 코드를 재게시하는 경우 하우스 룰이 적용된다는 점을 기억하세요.
면책사항
해당 정보와 게시물은 금융, 투자, 트레이딩 또는 기타 유형의 조언이나 권장 사항으로 간주되지 않으며, 트레이딩뷰에서 제공하거나 보증하는 것이 아닙니다. 자세한 내용은 이용 약관을 참조하세요.