OPEN-SOURCE SCRIPT
업데이트됨 Session TPO Market Profile

Introduction
Wikipedia:A Market Profile is an intra-day charting technique (price vertical, time/activity horizontal) devised by J. Peter Steidlmayer, a trader at the Chicago Board of Trade (CBOT), ca 1959-1985. Steidlmayer was seeking a way to determine and to evaluate market value as it developed in the day time frame. The concept was to display price on a vertical axis against time on the horizontal, and the ensuing graphic generally is a bell shape--fatter at the middle prices, with activity trailing off and volume diminished at the extreme higher and lower prices. In this structure he recognized the 'normal', Gaussian distribution he had been introduced to in college statistics.
Important : The market profile tool is designed to be used on the 30min timeframe, however, you can modify its parameters and use it on lower timeframes (15/10/5min)
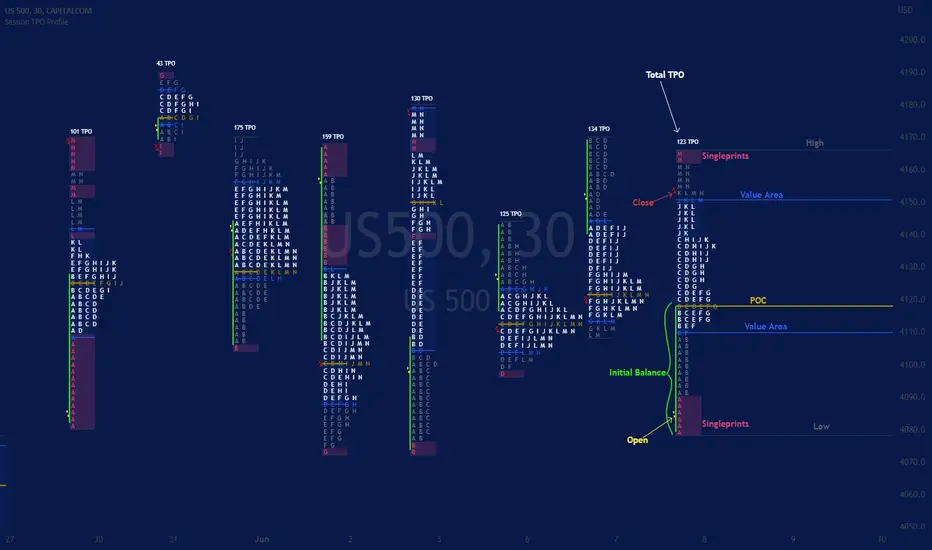
This indicators displays the following information
Parameters
Additional Notes
Wikipedia:A Market Profile is an intra-day charting technique (price vertical, time/activity horizontal) devised by J. Peter Steidlmayer, a trader at the Chicago Board of Trade (CBOT), ca 1959-1985. Steidlmayer was seeking a way to determine and to evaluate market value as it developed in the day time frame. The concept was to display price on a vertical axis against time on the horizontal, and the ensuing graphic generally is a bell shape--fatter at the middle prices, with activity trailing off and volume diminished at the extreme higher and lower prices. In this structure he recognized the 'normal', Gaussian distribution he had been introduced to in college statistics.
Important : The market profile tool is designed to be used on the 30min timeframe, however, you can modify its parameters and use it on lower timeframes (15/10/5min)
This indicators displays the following information
- Session open
- TPO
- Value area calculation zone
- POC
- Highlight of Single prints
- Session High/Low
- The current price (TPO Profile is often used isolated without any candlesticks on it)
Parameters
- Session beginning configuration (not coded with a session input yet)
- Number of candles to use for calculation (default 13 for a single session)
- Extend yesterday's levels (VAH/VAL/POC)
- Show/Hide Market profile calculation area (background color)
- Bars number (number of rows that will be used to draw the profile)
- Show/Hide TPO's
- TPO Colors customization (For in/out of VA, VAL/VAH/POC/High/Low levels and single prints)
- Show/Hide High/Low levels
- Show/Hide VAL/VAH/POC Levels as lines
- Enable/Disable Single prints highlighting
- Value area size (as percent)
- Show/Hide current price (corresponding to a line scaled on the "close" price)
Additional Notes
- Each session is drawn when the day is over
- To use as much space as possible, TPO's are not directly drawn on the area of their calculation (which can be confusing if you use candlesticks directly over it)
- This script will probably be updated in the future (especially concerning its implementation which is a bit spaghetti coded for now).
- If you have interesting suggestions about new features that are usual within market profile tools and missing from this script , don't hesitate to suggest it.
릴리즈 노트
Update:- Letters numbers
- The session calculation is now based on an extended characters set -> "ABCDEFGHIJKLMNOPQRSTUVWXYZabcdefghijklmnopqrstuvwxyz0123456789{[|]}@$€£*", in order to support longer sessions on timeframes lower than 30min
릴리즈 노트
Update- Opening price of the configured session is now correctly scaled with a dedicated line
릴리즈 노트
Update:- TPO size can now be defined by a ticks number
- On option to scale TPO on a rounded value corresponding to the ticks number is set by default
- You can now change the size of TPO letters (Tiny, Small, Normal) (default: Small)
릴리즈 노트
Default ticks size now set to 25릴리즈 노트
Update:- Single prints can now be extended
릴리즈 노트
Update:- A basic initial balance implementation has been added (Only consider A and B periods, undepending on your timeframe for the moment)
- Closing Price mark
- Customizable Spacing between Letters
- VA zone is now highlighted
릴리즈 노트
Few improvements- Close price displayed on the left
- Total TPO added
- Default colors modified
오픈 소스 스크립트
트레이딩뷰의 진정한 정신에 따라, 이 스크립트의 작성자는 이를 오픈소스로 공개하여 트레이더들이 기능을 검토하고 검증할 수 있도록 했습니다. 작성자에게 찬사를 보냅니다! 이 코드는 무료로 사용할 수 있지만, 코드를 재게시하는 경우 하우스 룰이 적용된다는 점을 기억하세요.
면책사항
해당 정보와 게시물은 금융, 투자, 트레이딩 또는 기타 유형의 조언이나 권장 사항으로 간주되지 않으며, 트레이딩뷰에서 제공하거나 보증하는 것이 아닙니다. 자세한 내용은 이용 약관을 참조하세요.
오픈 소스 스크립트
트레이딩뷰의 진정한 정신에 따라, 이 스크립트의 작성자는 이를 오픈소스로 공개하여 트레이더들이 기능을 검토하고 검증할 수 있도록 했습니다. 작성자에게 찬사를 보냅니다! 이 코드는 무료로 사용할 수 있지만, 코드를 재게시하는 경우 하우스 룰이 적용된다는 점을 기억하세요.
면책사항
해당 정보와 게시물은 금융, 투자, 트레이딩 또는 기타 유형의 조언이나 권장 사항으로 간주되지 않으며, 트레이딩뷰에서 제공하거나 보증하는 것이 아닙니다. 자세한 내용은 이용 약관을 참조하세요.