INVITE-ONLY SCRIPT
업데이트됨 AIChannel Strategy
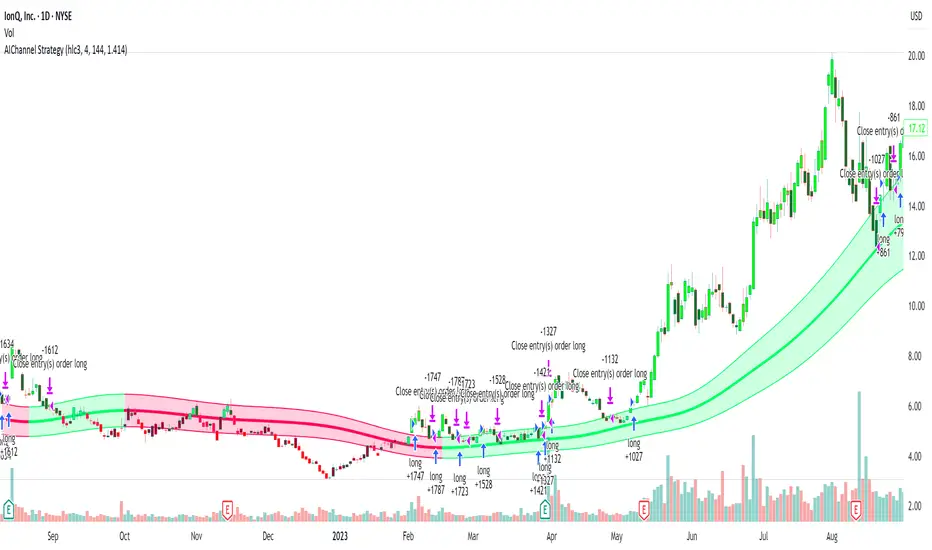
AIChannel Strategy is a long-only breakout system that trades when price closes above a dynamic upper band derived from a Gaussian-style filter. The channel width adapts to volatility using True Range, so signals naturally thin out during quiet markets and expand during trends.
How it works (under the hood)
Builds a Gaussian-like smoothing filter by cascading EMAs (AIFilter) using a tunable number of poles.
Optionally applies lag reduction (simple look-ahead compensation) and a Fast Response mode (averages with a 1-pole version).
Computes upper/lower bands:
upper = filter + (filter of True Range) × multiplier
lower = filter − (filter of True Range) × multiplier
Entry: when close crosses above the upper band and the bar time is within the selected date range.
Exit: when close crosses back below the upper band.
Includes an equity-line plot and optional (commented) CAGR / Max-DD ratio calculation for quick performance diagnostics.
Inputs (quick guide)
Source (src) – default hlc3.
Poles (1–9) – more poles → smoother, slower filter. Default 4.
Period – base smoothing length (default 144).
Range Multiplier – scales band width (default 1.414).
Reduced Lag – simple lag compensation toggle.
Fast Response – blends in a 1-pole filter for snappier turns.
Start/End Date – trades only inside this window (default 2018-01-01 → 2069-01-01).
Default backtest settings (in code)
1D timeframe (recommended for BTCUSD).
100% of equity per trade (strategy.percent_of_equity = 100).
Commission 0.1%, 1 tick slippage.
No shorts, no pyramiding beyond one position.
Best use
Designed for trend-following on assets with powerful expansions (e.g., BTCUSD 1D).
If your market is choppy, consider increasing Period and/or Range Multiplier, or enabling Fast Response off (for fewer signals).
Notes & Limitations
Exits are only by crossunder of the upper band; there is no explicit stop-loss or take-profit in this base version.
The CAGR/Max-DD lines are computed but plots are commented out—uncomment if you want to visualize them.
As with all backtests, results depend on exchange feed, session, commissions, and slippage.
Disclaimers
This script is for research/education. It is not financial advice. Always validate on your own data and risk parameters before live use.
Keywords / Tags
Trend, Breakout, Gaussian, EMA, Volatility, True Range, BTCUSD, Long-Only, Daily, Systematic
릴리즈 노트
AIChannel Strategy is a long-only breakout system that trades when price closes above a dynamic upper band derived from a Gaussian-style filter. The channel width adapts to volatility using True Range, so signals naturally thin out during quiet markets and expand during trends.How it works (under the hood)
Builds a Gaussian-like smoothing filter by cascading EMAs (AIFilter) using a tunable number of poles.
Optionally applies lag reduction (simple look-ahead compensation) and a Fast Response mode (averages with a 1-pole version).
Computes upper/lower bands:
upper = filter + (filter of True Range) × multiplier
lower = filter − (filter of True Range) × multiplier
Entry: when close crosses above the upper band and the bar time is within the selected date range.
Exit: when close crosses back below the upper band.
Inputs (quick guide)
Source (src) – default hlc3.
Poles (1–9) – more poles → smoother, slower filter. Default 4.
Period – base smoothing length (default 144).
Range Multiplier – scales band width (default 1.414).
Reduced Lag – simple lag compensation toggle.
Fast Response – blends in a 1-pole filter for snappier turns.
Default backtest settings (in code)
100% of equity per trade (strategy.percent_of_equity = 100).
Commission 0.1%, 1 tick slippage.
No shorts, no pyramiding beyond one position.
Best use
Designed for trend-following on assets with powerful expansions (e.g., BTCUSD 1D).
If your market is choppy, consider increasing Period and/or Range Multiplier, or enabling Fast Response off (for fewer signals).
Notes & Limitations
Exits are only by crossunder of the upper band; there is no explicit stop-loss or take-profit in this base version.
The CAGR/Max-DD lines are computed but plots are commented out—uncomment if you want to visualize them.
As with all backtests, results depend on exchange feed, session, commissions, and slippage.
Disclaimers
This script is for research/education. It is not financial advice. Always validate on your own data and risk parameters before live use.
초대 전용 스크립트
이 스크립트는 작성자가 승인한 사용자만 접근할 수 있습니다. 사용하려면 요청 후 승인을 받아야 하며, 일반적으로 결제 후에 허가가 부여됩니다. 자세한 내용은 아래 작성자의 안내를 따르거나 ADXAE에게 직접 문의하세요.
트레이딩뷰는 스크립트의 작동 방식을 충분히 이해하고 작성자를 완전히 신뢰하지 않는 이상, 해당 스크립트에 비용을 지불하거나 사용하는 것을 권장하지 않습니다. 커뮤니티 스크립트에서 무료 오픈소스 대안을 찾아보실 수도 있습니다.
작성자 지시 사항
Send me a request.
면책사항
해당 정보와 게시물은 금융, 투자, 트레이딩 또는 기타 유형의 조언이나 권장 사항으로 간주되지 않으며, 트레이딩뷰에서 제공하거나 보증하는 것이 아닙니다. 자세한 내용은 이용 약관을 참조하세요.