OPEN-SOURCE SCRIPT
업데이트됨 Price levels

Thanks to the developers for adding arrays to TradingView. This gives you more freedom in Pine Script coding.
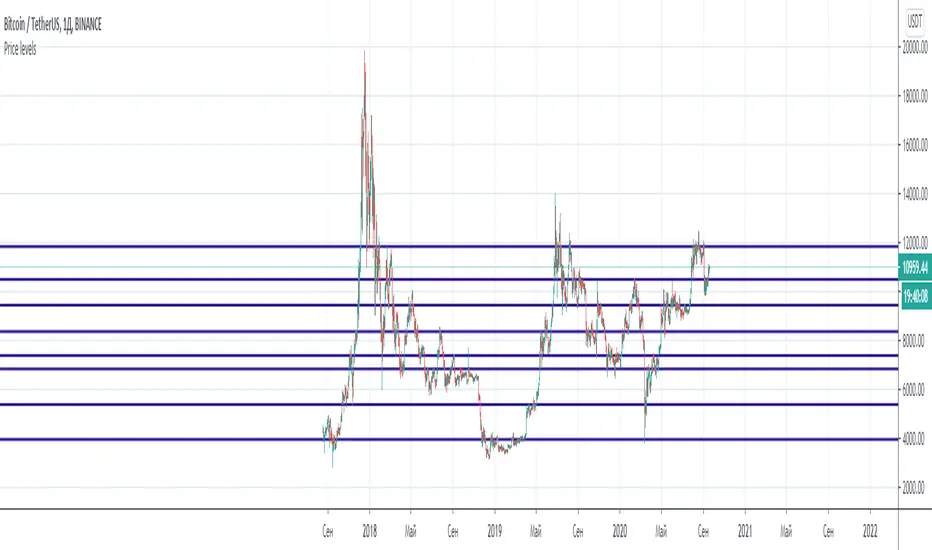
I have created an algorithm that draws support and resistance levels on a chart. The algorithm can be easily customized as you need.
This algorithm can help both intuitive and system traders. Intuitive traders just look at the drawn lines. For system traders, the "levels" array stores all level values. Thus, you can use these values for algorithmic trading.
릴리즈 노트
Now you can set the number of historical bars to search for a level. This will avoid getting random levels. Also, you can set a limit on the number of lines on the chart. The old levels will be deleted and will not bother you.It should be noted that this algorithm is difficult to use on small timeframes due to the limited capabilities of the Pine Script. We can reference a maximum of 5000 historical bars in cycles. Also, the script may receive an error due to a long calculation. Therefore, do not ask too much of the algorithm on small timeframes.
릴리즈 노트
Now you can graphically customize your indicator.릴리즈 노트
Fixed a small bug in the variable title.릴리즈 노트
made the code look nice!릴리즈 노트
made the code look nice!오픈 소스 스크립트
트레이딩뷰의 진정한 정신에 따라, 이 스크립트의 작성자는 이를 오픈소스로 공개하여 트레이더들이 기능을 검토하고 검증할 수 있도록 했습니다. 작성자에게 찬사를 보냅니다! 이 코드는 무료로 사용할 수 있지만, 코드를 재게시하는 경우 하우스 룰이 적용된다는 점을 기억하세요.
면책사항
해당 정보와 게시물은 금융, 투자, 트레이딩 또는 기타 유형의 조언이나 권장 사항으로 간주되지 않으며, 트레이딩뷰에서 제공하거나 보증하는 것이 아닙니다. 자세한 내용은 이용 약관을 참조하세요.
오픈 소스 스크립트
트레이딩뷰의 진정한 정신에 따라, 이 스크립트의 작성자는 이를 오픈소스로 공개하여 트레이더들이 기능을 검토하고 검증할 수 있도록 했습니다. 작성자에게 찬사를 보냅니다! 이 코드는 무료로 사용할 수 있지만, 코드를 재게시하는 경우 하우스 룰이 적용된다는 점을 기억하세요.
면책사항
해당 정보와 게시물은 금융, 투자, 트레이딩 또는 기타 유형의 조언이나 권장 사항으로 간주되지 않으며, 트레이딩뷰에서 제공하거나 보증하는 것이 아닙니다. 자세한 내용은 이용 약관을 참조하세요.