PROTECTED SOURCE SCRIPT
업데이트됨 Sesame Street Box
The Sesame Street Box is a 100% original candlestick pattern by it's creator. ICT invented order blocks, I have invented the Sesame Street Box.
This candlestick pattern draws a retouch box. In particular, in an up trend, it finds one down closed candle that has at least 3 up closed candles before it, and 3 or more up closed candles after it. 3-1-3 candle stick pattern. The 3 or more candles after it MUST leave the candlestick range of the down closed candle for the box to draw. The box is drawn from the low of the down closed candle to the high of the down closed candle and extended to the right. Once price reaches into this box, you would long off the top of the rendered box for continuation.
The reverse is true for shorts. For shorts, there would be 3 or more down closed candles, 1 up closed candle, followed by 3 or more down closed candles that leave the up closed candle's range. If these conditions are met, a box is drawn. The box is drawn from the low of the up closed candle to the high of the up closed candle and extended to the right. Once price reaches into this box, you would short off the bottom of the rendered box for continuation.
This indicator also provides 2 optional time frames to render the same pattern on your active chart. If you do not want to use these, just leave the option set as chart, and only the active timeframe will render.
There is also an option to toggle how to handle the boxes once they are invalidated. Either you can delete them, or choose to have them stop rendering at the candle that invalidated them.
릴리즈 노트
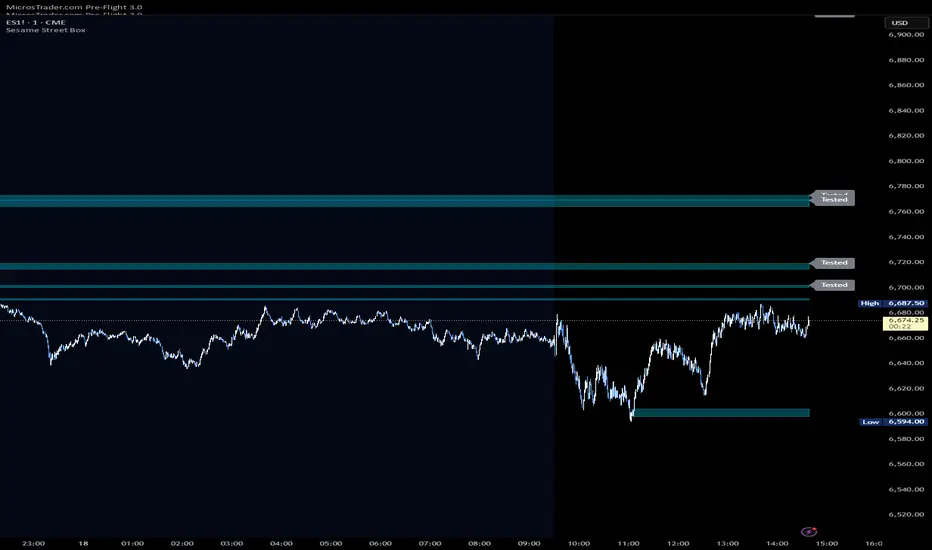
Added ability to show if box was tested.릴리즈 노트
Resolved minor bug with Optional Timeframes릴리즈 노트
Reuploaded with a clean chart릴리즈 노트
Reuploaded with a clean chart showing Tested Label릴리즈 노트
2 Bugs Fixed.1. Rendering alternate timeframe boxes were offset slightly off
2. If the pattern happened back to back, it wasn't getting picked up on the 2nd box.
릴리즈 노트
There was a breaking change with the last publishing that prevented script from compiling. Republish. 보호된 스크립트입니다
이 스크립트는 비공개 소스로 게시됩니다. 하지만 이를 자유롭게 제한 없이 사용할 수 있습니다 – 자세한 내용은 여기에서 확인하세요.
면책사항
해당 정보와 게시물은 금융, 투자, 트레이딩 또는 기타 유형의 조언이나 권장 사항으로 간주되지 않으며, 트레이딩뷰에서 제공하거나 보증하는 것이 아닙니다. 자세한 내용은 이용 약관을 참조하세요.
면책사항
해당 정보와 게시물은 금융, 투자, 트레이딩 또는 기타 유형의 조언이나 권장 사항으로 간주되지 않으며, 트레이딩뷰에서 제공하거나 보증하는 것이 아닙니다. 자세한 내용은 이용 약관을 참조하세요.