OPEN-SOURCE SCRIPT
Lunar Sentiment Bands
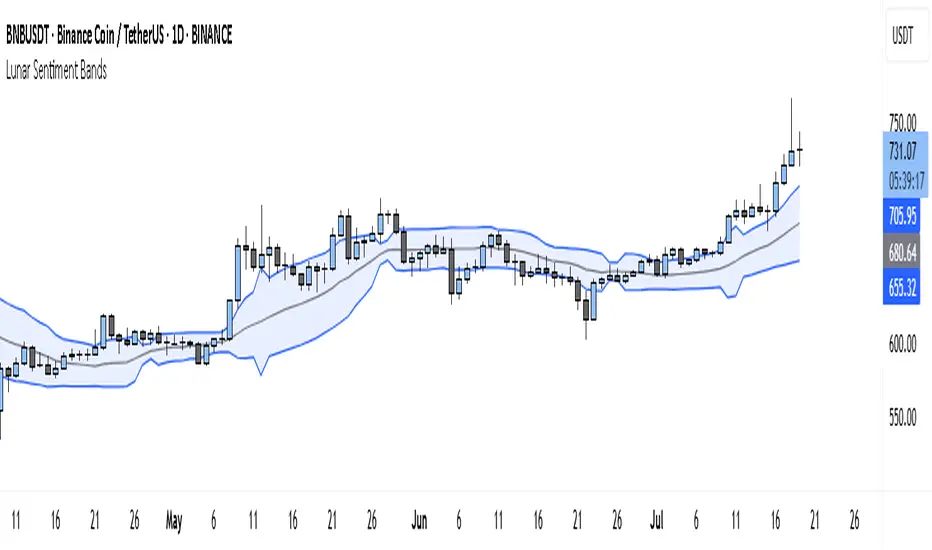
The Lunar Sentiment Bands indicator is designed to combine simple price volatility analysis with the timing of moon phases. It's based on a moving average and two bands above and below it—similar to Bollinger Bands. But unlike regular bands, the width of these adjusts dynamically depending on two key conditions: the moon phase and market volume.
Around Full Moons, markets often show emotional or volatile behavior. If there's also a surge in trading volume during that time, the indicator automatically expands the bands. This tells you the market might be gearing up for a breakout or high-energy move.
Around New Moons, things are typically quieter. If there’s no significant volume, the indicator contracts the bands. This reflects a calmer environment or a potential “coil” where price is building up energy.
Traders can use this shifting bandwidth to guide decisions. Wide bands suggest breakout potential—either to join the move or to stand back until direction becomes clearer. Narrow bands suggest you may want to trade reversals, or simply wait for volatility to return before entering a position.
This approach doesn't try to predict direction. Instead, it gives you a sense of when the market is most likely to become active or stay quiet, using the rhythm of the moon and real-time volume to shape that view.
오픈 소스 스크립트
트레이딩뷰의 진정한 정신에 따라, 이 스크립트의 작성자는 이를 오픈소스로 공개하여 트레이더들이 기능을 검토하고 검증할 수 있도록 했습니다. 작성자에게 찬사를 보냅니다! 이 코드는 무료로 사용할 수 있지만, 코드를 재게시하는 경우 하우스 룰이 적용된다는 점을 기억하세요.
Trade forex, indices, stocks and metals with up to US$100.000 in company's funding.
Complete a challenge to access funding or go for instant deposit.
Trading involves substantial risk. Not financial advice
Complete a challenge to access funding or go for instant deposit.
Trading involves substantial risk. Not financial advice
면책사항
해당 정보와 게시물은 금융, 투자, 트레이딩 또는 기타 유형의 조언이나 권장 사항으로 간주되지 않으며, 트레이딩뷰에서 제공하거나 보증하는 것이 아닙니다. 자세한 내용은 이용 약관을 참조하세요.