OPEN-SOURCE SCRIPT
Engulfing & Pin Bar Detector
Overview
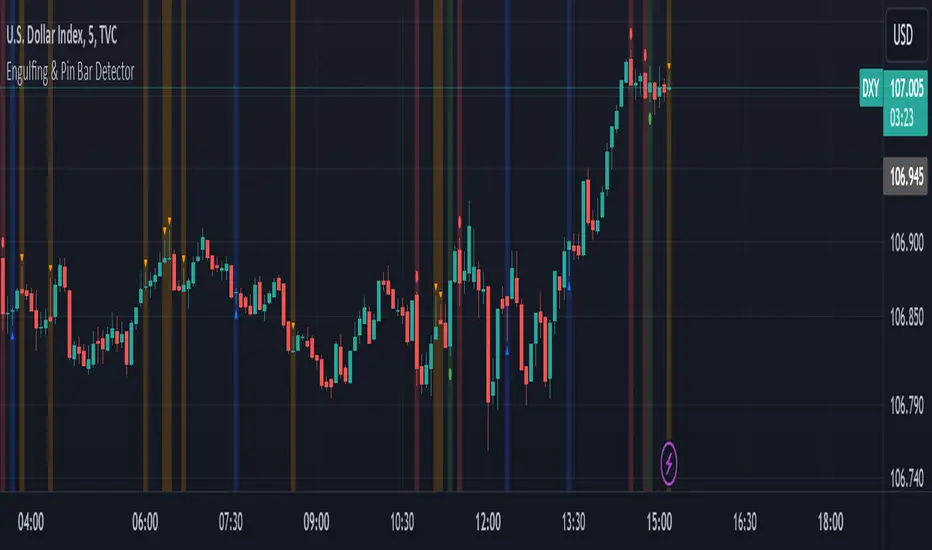
The "Engulfing & Pin Bar Detector" script identifies two important candlestick patterns: Engulfing Candles and Pin Bars. These patterns are widely used in technical analysis to signal potential reversals or continuations in the market. The script provides visual signals directly on the chart to help traders make informed decisions.
Features Bullish Engulfing:
The second candle completely engulfs the body and shadows (high and low) of the previous bearish candle.
Signals a potential reversal to the upside.
Marked with a green background and a label below the candle.
Bearish Engulfing:
The second candle completely engulfs the body and shadows (high and low) of the previous bullish candle.
Signals a potential reversal to the downside.
Marked with a red background and a label above the candle.
Bullish Pin Bar:
A candle with a long lower shadow and a small body near the top of the range.
Indicates potential upward price action.
Marked with a blue background and an upward triangle below the candle.
Bearish Pin Bar:
A candle with a long upper shadow and a small body near the bottom of the range.
Indicates potential downward price action.
Marked with an orange background and a downward triangle above the candle.
Customizable Visual Alerts:
Background highlights and shape markers for quick and easy identification of patterns.
How to Use
Add the script to your TradingView chart.
Look for:
Green background: Bullish Engulfing.
Red background: Bearish Engulfing.
Blue background: Bullish Pin Bar.
Orange background: Bearish Pin Bar.
Combine with other indicators or price action techniques for confirmation.
Adjust your entry and exit strategies based on the patterns:
For Bullish Engulfing or Bullish Pin Bar, consider entering long positions or exiting shorts.
For Bearish Engulfing or Bearish Pin Bar, consider entering short positions or exiting longs.
Example Use Cases
Identify potential reversal zones.
Use as confirmation in trend-following or counter-trend strategies.
Enhance your analysis with clear visual signals.
오픈 소스 스크립트
트레이딩뷰의 진정한 정신에 따라, 이 스크립트의 작성자는 이를 오픈소스로 공개하여 트레이더들이 기능을 검토하고 검증할 수 있도록 했습니다. 작성자에게 찬사를 보냅니다! 이 코드는 무료로 사용할 수 있지만, 코드를 재게시하는 경우 하우스 룰이 적용된다는 점을 기억하세요.
면책사항
해당 정보와 게시물은 금융, 투자, 트레이딩 또는 기타 유형의 조언이나 권장 사항으로 간주되지 않으며, 트레이딩뷰에서 제공하거나 보증하는 것이 아닙니다. 자세한 내용은 이용 약관을 참조하세요.
오픈 소스 스크립트
트레이딩뷰의 진정한 정신에 따라, 이 스크립트의 작성자는 이를 오픈소스로 공개하여 트레이더들이 기능을 검토하고 검증할 수 있도록 했습니다. 작성자에게 찬사를 보냅니다! 이 코드는 무료로 사용할 수 있지만, 코드를 재게시하는 경우 하우스 룰이 적용된다는 점을 기억하세요.
면책사항
해당 정보와 게시물은 금융, 투자, 트레이딩 또는 기타 유형의 조언이나 권장 사항으로 간주되지 않으며, 트레이딩뷰에서 제공하거나 보증하는 것이 아닙니다. 자세한 내용은 이용 약관을 참조하세요.