PROTECTED SOURCE SCRIPT
Sri - Custom Timeframe Candle / Heikin Ashi
Sri - Custom Timeframe Candle / Heikin Ashi (Week & Day) + Label
Short Title: Sri - Smart Candles
Pine Script Version: 5
Overlay: Yes
Description:
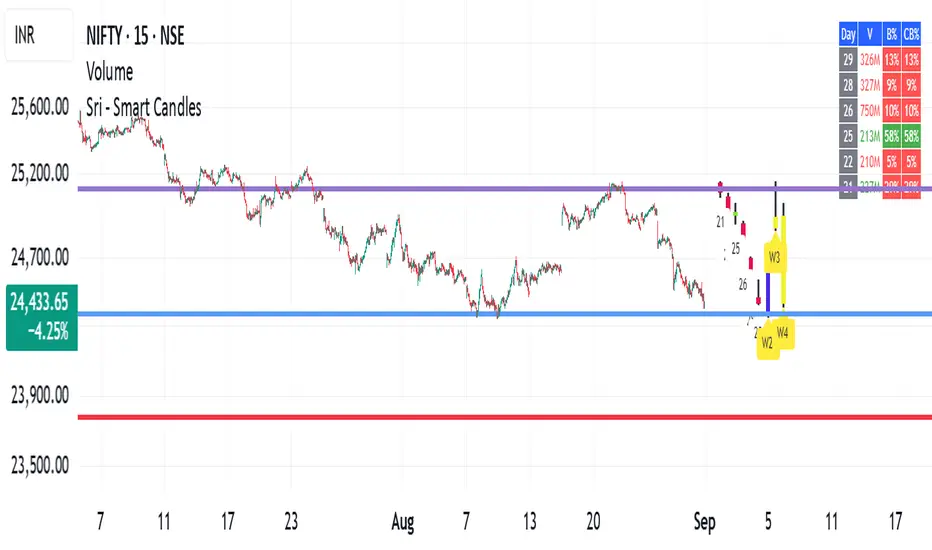
The Sri - Smart Candles indicator allows traders to visualize historical and current daily and weekly candles on a single chart in a compact and customizable format. You can choose between Normal candles or Heikin Ashi candles for better trend visualization. The script displays previous 4 candles, the last candle, and the live candle with horizontal offset positioning to avoid overlapping the chart. Additionally, the indicator includes customizable labels for days or week numbers, helping traders quickly analyze patterns and trends.
This indicator is ideal for traders who want to see higher timeframe candle patterns on lower timeframe charts (like 5-min, 15-min, or 1-hour charts) without switching timeframes.
Key Features:
Custom Candle Types: Normal or Heikin Ashi.
Daily & Weekly Candle Blocks: View previous 4 + last + live candles.
Custom Colors: Bull, bear, and wick colors configurable.
Candle Positioning: Horizontal offsets, thickness, and gaps configurable.
Labels: Day numbers or week numbers displayed at Top, Bottom, or Absolute level.
Multi-Timeframe Visualization: See daily and weekly candles on lower timeframe charts.
Advantages:
✅ Helps visualize higher timeframe trends on lower timeframe charts.
✅ Easy to identify bullish and bearish candle patterns.
✅ Customizable for personal visual preference (colors, size, offsets).
✅ Labels allow quick recognition of days/weeks without cluttering the chart.
✅ Works on small timeframes (1-min, 5-min, 15-min) for intraday analysis.
Pros:
Clean and intuitive display of daily/weekly candles.
Can combine Normal and Heikin Ashi visualizations.
Helps confirm trend direction before taking trades.
Non-intrusive overlay: does not interfere with main chart candles.
Cons:
Static candle representation; does not replace real-time trading candles.
May be slightly heavy on chart performance if too many candles are drawn.
Horizontal offsets require manual adjustment for crowded charts.
How to Use on Small Timeframes:
Apply the indicator on a small timeframe chart (e.g., 5-min, 15-min).
Select Candle Type: Normal or Heikin Ashi.
Adjust Daily and Weekly offsets to prevent overlap with your main chart.
Choose colors for bullish, bearish candles, and wicks.
Use Label Position to show day/week numbers on top, bottom, or a fixed level.
Analyze the previous 4 + last + live candles for trend direction and potential entry/exit zones.
Tip: Combine this with other indicators (like RSI, MACD, or volume) on small timeframes for better intraday trading accuracy.
Short Title: Sri - Smart Candles
Pine Script Version: 5
Overlay: Yes
Description:
The Sri - Smart Candles indicator allows traders to visualize historical and current daily and weekly candles on a single chart in a compact and customizable format. You can choose between Normal candles or Heikin Ashi candles for better trend visualization. The script displays previous 4 candles, the last candle, and the live candle with horizontal offset positioning to avoid overlapping the chart. Additionally, the indicator includes customizable labels for days or week numbers, helping traders quickly analyze patterns and trends.
This indicator is ideal for traders who want to see higher timeframe candle patterns on lower timeframe charts (like 5-min, 15-min, or 1-hour charts) without switching timeframes.
Key Features:
Custom Candle Types: Normal or Heikin Ashi.
Daily & Weekly Candle Blocks: View previous 4 + last + live candles.
Custom Colors: Bull, bear, and wick colors configurable.
Candle Positioning: Horizontal offsets, thickness, and gaps configurable.
Labels: Day numbers or week numbers displayed at Top, Bottom, or Absolute level.
Multi-Timeframe Visualization: See daily and weekly candles on lower timeframe charts.
Advantages:
✅ Helps visualize higher timeframe trends on lower timeframe charts.
✅ Easy to identify bullish and bearish candle patterns.
✅ Customizable for personal visual preference (colors, size, offsets).
✅ Labels allow quick recognition of days/weeks without cluttering the chart.
✅ Works on small timeframes (1-min, 5-min, 15-min) for intraday analysis.
Pros:
Clean and intuitive display of daily/weekly candles.
Can combine Normal and Heikin Ashi visualizations.
Helps confirm trend direction before taking trades.
Non-intrusive overlay: does not interfere with main chart candles.
Cons:
Static candle representation; does not replace real-time trading candles.
May be slightly heavy on chart performance if too many candles are drawn.
Horizontal offsets require manual adjustment for crowded charts.
How to Use on Small Timeframes:
Apply the indicator on a small timeframe chart (e.g., 5-min, 15-min).
Select Candle Type: Normal or Heikin Ashi.
Adjust Daily and Weekly offsets to prevent overlap with your main chart.
Choose colors for bullish, bearish candles, and wicks.
Use Label Position to show day/week numbers on top, bottom, or a fixed level.
Analyze the previous 4 + last + live candles for trend direction and potential entry/exit zones.
Tip: Combine this with other indicators (like RSI, MACD, or volume) on small timeframes for better intraday trading accuracy.
보호된 스크립트입니다
이 스크립트는 비공개 소스로 게시됩니다. 하지만 이를 자유롭게 제한 없이 사용할 수 있습니다 – 자세한 내용은 여기에서 확인하세요.
면책사항
해당 정보와 게시물은 금융, 투자, 트레이딩 또는 기타 유형의 조언이나 권장 사항으로 간주되지 않으며, 트레이딩뷰에서 제공하거나 보증하는 것이 아닙니다. 자세한 내용은 이용 약관을 참조하세요.
면책사항
해당 정보와 게시물은 금융, 투자, 트레이딩 또는 기타 유형의 조언이나 권장 사항으로 간주되지 않으며, 트레이딩뷰에서 제공하거나 보증하는 것이 아닙니다. 자세한 내용은 이용 약관을 참조하세요.