OPEN-SOURCE SCRIPT
Volume Delta Filtered v1.1 by Ramtraderbook
Indicator Explanation: Volume Delta_RTB (Filtered)
General Description
The Volume Delta_RTB (Filtered) indicator is designed to analyze the volume delta of a financial asset and highlight only significant changes based on a configured threshold. This indicator is useful for detecting moments when buying volume exceeds selling volume (or vice versa), providing a clear view of market pressure.
What is Volume Delta?
Volume delta measures the difference between buying and selling volume over a given time period. A positive delta indicates that buying prevails over selling, while a negative delta indicates the opposite.
Indicator Inputs
The indicator has several customizable parameters to suit the user’s needs:
1. Volume Delta Threshold
- Allows you to set a minimum volume delta value.
- Only indicator values that exceed this absolute delta threshold will be displayed.
- Default value: 100,000.
2. Use of a Lower Time Frame
- Option to analyze data from a lower time frame than the main chart.
Operating Logic
1. Selection of the Lower Time Frame
- The indicator scans data from a lower time frame to accurately calculate the volume delta.
- By default, it automatically selects an appropriate lower time frame, though it can be set manually.
2. Calculation of Volume Delta
- Using the `ta.requestVolumeDelta` function, the indicator calculates:
- Volume delta at the start of the period (`openVolume`).
- Maximum delta (`maxVolume`).
- Minimum delta (`minVolume`).
- Last recorded delta (`lastVolume`).
3. Filtering Values
- If the absolute value of `lastVolume` (the last volume delta) is below the configured threshold (`deltaThreshold`), the data will not be displayed on the chart.
- This allows the indicator to highlight only significant movements, avoiding unnecessary noise.
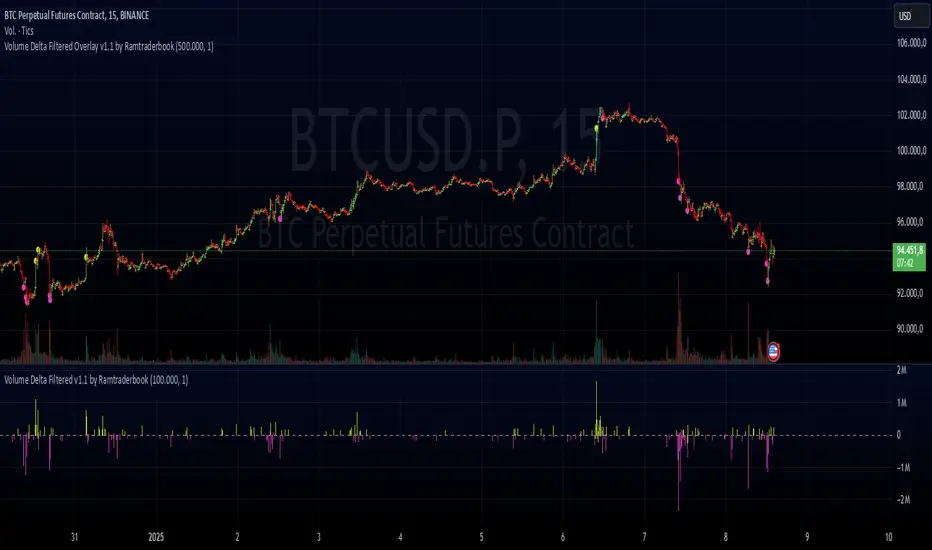
4. Visualization
- Volume delta is represented by candles to facilitate interpretation:
- Yellow candles for positive delta (buying prevails).
- Pink candles for negative delta (selling prevails).
- A horizontal line at `0` serves as a reference.
- Colors can be configured as needed.
5. Data Validation
- If the data provider does not provide volume information for the asset, the indicator will display an error message.
Indicator Advantages
- Efficient Filtering: Focus on the most relevant movements in terms of volume, ignoring small or insignificant values.
- Adaptable: Offers customization options for both the delta threshold and the time frame.
- Clear Visualization: Colored candles make it easier to spot dominant buying or selling trends.
NOTE:
- Estimated Delta Data: Since TradingView does not have access to market depth data or an exact breakdown of buying and selling volume, the delta calculations are approximations based on price and volume behavior.
- Data Provider Dependency: Some assets or instruments may not have volume information available, limiting the indicator’s use.
General Description
The Volume Delta_RTB (Filtered) indicator is designed to analyze the volume delta of a financial asset and highlight only significant changes based on a configured threshold. This indicator is useful for detecting moments when buying volume exceeds selling volume (or vice versa), providing a clear view of market pressure.
What is Volume Delta?
Volume delta measures the difference between buying and selling volume over a given time period. A positive delta indicates that buying prevails over selling, while a negative delta indicates the opposite.
Indicator Inputs
The indicator has several customizable parameters to suit the user’s needs:
1. Volume Delta Threshold
- Allows you to set a minimum volume delta value.
- Only indicator values that exceed this absolute delta threshold will be displayed.
- Default value: 100,000.
2. Use of a Lower Time Frame
- Option to analyze data from a lower time frame than the main chart.
Operating Logic
1. Selection of the Lower Time Frame
- The indicator scans data from a lower time frame to accurately calculate the volume delta.
- By default, it automatically selects an appropriate lower time frame, though it can be set manually.
2. Calculation of Volume Delta
- Using the `ta.requestVolumeDelta` function, the indicator calculates:
- Volume delta at the start of the period (`openVolume`).
- Maximum delta (`maxVolume`).
- Minimum delta (`minVolume`).
- Last recorded delta (`lastVolume`).
3. Filtering Values
- If the absolute value of `lastVolume` (the last volume delta) is below the configured threshold (`deltaThreshold`), the data will not be displayed on the chart.
- This allows the indicator to highlight only significant movements, avoiding unnecessary noise.
4. Visualization
- Volume delta is represented by candles to facilitate interpretation:
- Yellow candles for positive delta (buying prevails).
- Pink candles for negative delta (selling prevails).
- A horizontal line at `0` serves as a reference.
- Colors can be configured as needed.
5. Data Validation
- If the data provider does not provide volume information for the asset, the indicator will display an error message.
Indicator Advantages
- Efficient Filtering: Focus on the most relevant movements in terms of volume, ignoring small or insignificant values.
- Adaptable: Offers customization options for both the delta threshold and the time frame.
- Clear Visualization: Colored candles make it easier to spot dominant buying or selling trends.
NOTE:
- Estimated Delta Data: Since TradingView does not have access to market depth data or an exact breakdown of buying and selling volume, the delta calculations are approximations based on price and volume behavior.
- Data Provider Dependency: Some assets or instruments may not have volume information available, limiting the indicator’s use.
오픈 소스 스크립트
트레이딩뷰의 진정한 정신에 따라, 이 스크립트의 작성자는 이를 오픈소스로 공개하여 트레이더들이 기능을 검토하고 검증할 수 있도록 했습니다. 작성자에게 찬사를 보냅니다! 이 코드는 무료로 사용할 수 있지만, 코드를 재게시하는 경우 하우스 룰이 적용된다는 점을 기억하세요.
면책사항
해당 정보와 게시물은 금융, 투자, 트레이딩 또는 기타 유형의 조언이나 권장 사항으로 간주되지 않으며, 트레이딩뷰에서 제공하거나 보증하는 것이 아닙니다. 자세한 내용은 이용 약관을 참조하세요.
오픈 소스 스크립트
트레이딩뷰의 진정한 정신에 따라, 이 스크립트의 작성자는 이를 오픈소스로 공개하여 트레이더들이 기능을 검토하고 검증할 수 있도록 했습니다. 작성자에게 찬사를 보냅니다! 이 코드는 무료로 사용할 수 있지만, 코드를 재게시하는 경우 하우스 룰이 적용된다는 점을 기억하세요.
면책사항
해당 정보와 게시물은 금융, 투자, 트레이딩 또는 기타 유형의 조언이나 권장 사항으로 간주되지 않으며, 트레이딩뷰에서 제공하거나 보증하는 것이 아닙니다. 자세한 내용은 이용 약관을 참조하세요.