OPEN-SOURCE SCRIPT
업데이트됨 Table rsi multiframes(by Lc_M)
- Simultaneous display of RSI values on cells corresponding to each selected timeframe, organized in an intuitive table, adjustable in size and position.
- Color indicator on each cell that presents RSI values within the overbought and oversold levels. example: if the user wants to set the O.S/O.B levels to 20 - 80, the colored cells will only appear at "RSI" => 80 and "RSI" <= 20.
- Free configuration of graphic times, lengths and O.B/O.S, according to user standards
릴리즈 노트
Bug fix릴리즈 노트
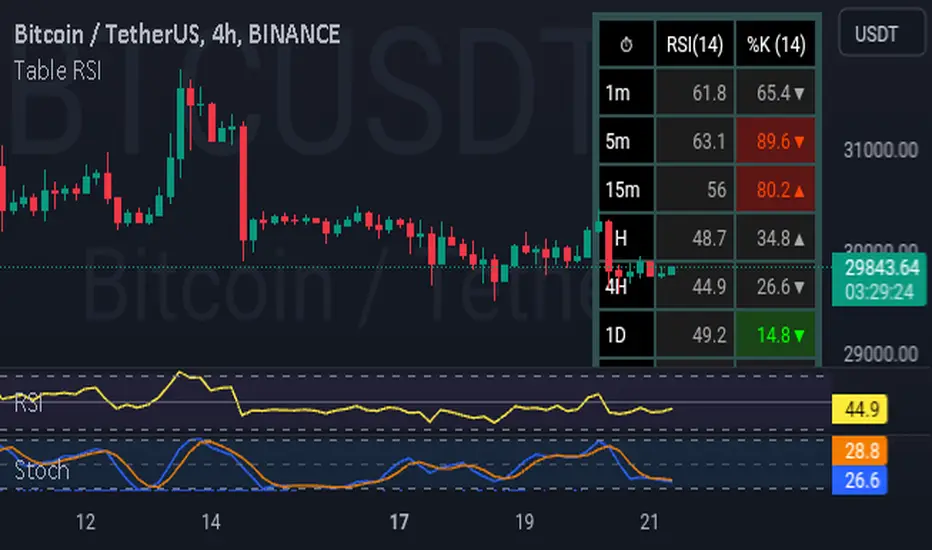
This table groups together a set of values referring to the RSI of each selected timeframe so that the user can follow them simultaneously.And to serve users who seek a more refined analysis, especially in the short term, a new column was implemented in this upgrade, containing the values of the stochastic indicator.
Check the Feat:
► Table with size and position adjustment, and selection of up to 7 different timeframes.
► COLUMN RSI: displays the values corresponding to each TF, allowing the user to adjust the length and font.
► COLOR INDICATOR ABOUT THE CELL: as the RSI reaches overbought/oversold levels, the cells tend to change their colors to red (RSI >= O.B) or green (RSI <= O.S), whatever the chart period.
((NOTE)): The O.B/O.S standards can be modified by the user, the color indicator automatically adapts to the established standards.
UPDATES:
•►► ENABLE/DISABLE TIMEFRAME: allows the user to keep a smaller amount of TF to be displayed in the table, as desired.
•►► STOCHASTIC OSCILLATOR : column with stochastic oscillator values for short-term analysis, with adjustments for %K Length, %K Smooth and %D values.
•►► COLOR INDICATOR ABOUT CELL: The functionality applied to RSI values is also applicable to stochastic values. It is worth mentioning that the adjustments of one do not interfere with the other, each one is individually adjustable.
•►► DIRECTIONAL ARROW: applicable only to the Stochastic column, this function informs the user when the value of line %K is above or below the value of line %D.
오픈 소스 스크립트
트레이딩뷰의 진정한 정신에 따라, 이 스크립트의 작성자는 이를 오픈소스로 공개하여 트레이더들이 기능을 검토하고 검증할 수 있도록 했습니다. 작성자에게 찬사를 보냅니다! 이 코드는 무료로 사용할 수 있지만, 코드를 재게시하는 경우 하우스 룰이 적용된다는 점을 기억하세요.
면책사항
해당 정보와 게시물은 금융, 투자, 트레이딩 또는 기타 유형의 조언이나 권장 사항으로 간주되지 않으며, 트레이딩뷰에서 제공하거나 보증하는 것이 아닙니다. 자세한 내용은 이용 약관을 참조하세요.
오픈 소스 스크립트
트레이딩뷰의 진정한 정신에 따라, 이 스크립트의 작성자는 이를 오픈소스로 공개하여 트레이더들이 기능을 검토하고 검증할 수 있도록 했습니다. 작성자에게 찬사를 보냅니다! 이 코드는 무료로 사용할 수 있지만, 코드를 재게시하는 경우 하우스 룰이 적용된다는 점을 기억하세요.
면책사항
해당 정보와 게시물은 금융, 투자, 트레이딩 또는 기타 유형의 조언이나 권장 사항으로 간주되지 않으며, 트레이딩뷰에서 제공하거나 보증하는 것이 아닙니다. 자세한 내용은 이용 약관을 참조하세요.