OPEN-SOURCE SCRIPT
Power Market
Power Market Indicator
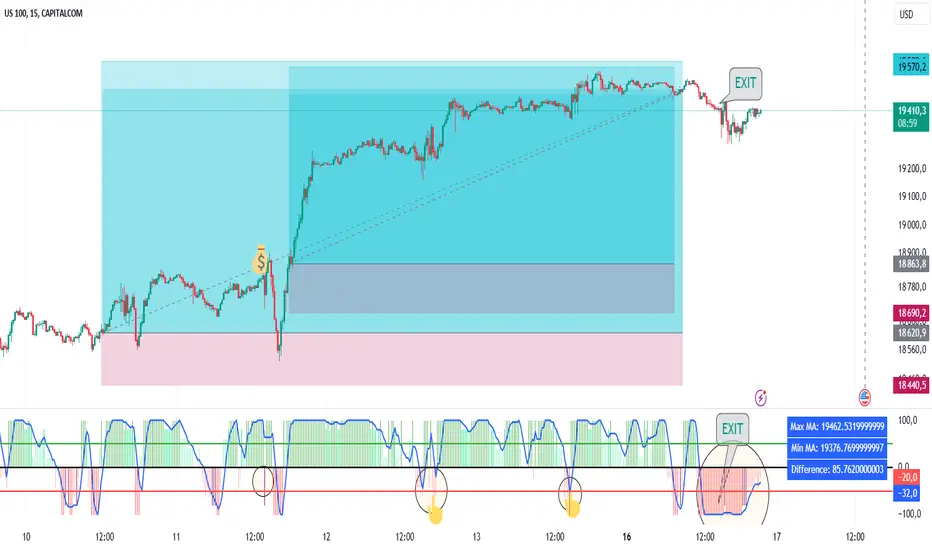
Description: The Power Market Indicator is designed to help traders assess market strength and make informed decisions for entering and exiting positions. This innovative indicator provides a comprehensive view of the evolution of Simple Moving Averages (SMA) over different periods and offers a clear measure of market strength through a total score.
Key Features:
Multi-Period SMA Analysis:
Calculates Simple Moving Averages (SMA) for 10 different periods ranging from 10 to 100.
Provides detailed analysis by comparing the current closing price with these SMAs.
Market Strength Measurement:
Assesses market strength by calculating a total score based on the relationship between the closing price and the SMAs.
The total score is displayed as a histogram with distinct colors for positive and negative values.
Smoothed Curve for Better View:
A smoothing of the total score is applied using a 5-period Simple Moving Average to represent the overall trend more smoothly.
Dynamic Information Table:
Real-time display of the maximum and minimum values among the SMAs, as well as the difference between these values, providing valuable insights into the variability of moving averages.
Visual Reference Lines:
Horizontal lines at zero, +50, and -50 for easy evaluation of key score levels.
How to Use the Indicator:
Position Entries: Use high positive scores to identify buying opportunities when market strength is strong.
Position Exits: Negative scores may signal market weakness, allowing you to exit positions or wait for a better opportunity.
Data Analysis: The table helps you understand the variability of SMAs, offering additional context for your trading decisions.
This powerful tool provides an in-depth view of market dynamics and helps you navigate your trading strategies with greater confidence. Embrace the Power Market Indicator and optimize your trading decisions today!
오픈 소스 스크립트
트레이딩뷰의 진정한 정신에 따라, 이 스크립트의 작성자는 이를 오픈소스로 공개하여 트레이더들이 기능을 검토하고 검증할 수 있도록 했습니다. 작성자에게 찬사를 보냅니다! 이 코드는 무료로 사용할 수 있지만, 코드를 재게시하는 경우 하우스 룰이 적용된다는 점을 기억하세요.
면책사항
해당 정보와 게시물은 금융, 투자, 트레이딩 또는 기타 유형의 조언이나 권장 사항으로 간주되지 않으며, 트레이딩뷰에서 제공하거나 보증하는 것이 아닙니다. 자세한 내용은 이용 약관을 참조하세요.
오픈 소스 스크립트
트레이딩뷰의 진정한 정신에 따라, 이 스크립트의 작성자는 이를 오픈소스로 공개하여 트레이더들이 기능을 검토하고 검증할 수 있도록 했습니다. 작성자에게 찬사를 보냅니다! 이 코드는 무료로 사용할 수 있지만, 코드를 재게시하는 경우 하우스 룰이 적용된다는 점을 기억하세요.
면책사항
해당 정보와 게시물은 금융, 투자, 트레이딩 또는 기타 유형의 조언이나 권장 사항으로 간주되지 않으며, 트레이딩뷰에서 제공하거나 보증하는 것이 아닙니다. 자세한 내용은 이용 약관을 참조하세요.