OPEN-SOURCE SCRIPT
업데이트됨 SMA DMA Crossing Signal
SMA and DMA Crossing Buy Sell Signals
This script implements a Double Moving Average (DMA) strategy, a popular technical analysis technique used by traders to identify trends and potential buy/sell signals in financial markets.
**Description:**
The Double Moving Average strategy involves the calculation of two moving averages – a short-term moving average and a long-term moving average. In this script, we calculate these moving averages as follows:
1. **Short-term DMA (`dmaShort`):**
- Calculated using a 28-bar Simple Moving Average (SMA).
- Represents the shorter-term trend in the price movement.
2. **Long-term DMA (`dmaLong`):**
- Also calculated using a 28-bar SMA.
- Displaced backward by 14 bars (`dmaLong := request.security(syminfo.tickerid, "D", dmaLong[14])`), effectively creating a 28-bar SMA with a -14 bar displacement.
- Represents the longer-term trend in the price movement.
**Signals:**
Buy and sell signals are generated based on the crossing of the short-term DMA over or under the long-term DMA:
- **Buy Signal (`DMA BUY`):** Occurs when the short-term DMA crosses above the long-term DMA (`dmaBuySignal`).
- **Sell Signal (`DMA SELL`):** Occurs when the short-term DMA crosses below the long-term DMA (`dmaSellSignal`).
**How to Use:**
- **Buy Signal:** Consider entering a long position when the short-term DMA crosses above the long-term DMA, indicating a potential uptrend.
- **Sell Signal:** Consider exiting a long position or entering a short position when the short-term DMA crosses below the long-term DMA, indicating a potential downtrend.
This script provides a visual representation of the DMA crossover signals on the chart, helping traders identify potential entry and exit points in the market.
**Note:** It's important to combine DMA signals with other technical analysis tools and risk management strategies for informed trading decisions.
All comments are welcome..
릴리즈 노트
Double Moving Average Crossings IndicatorOverview
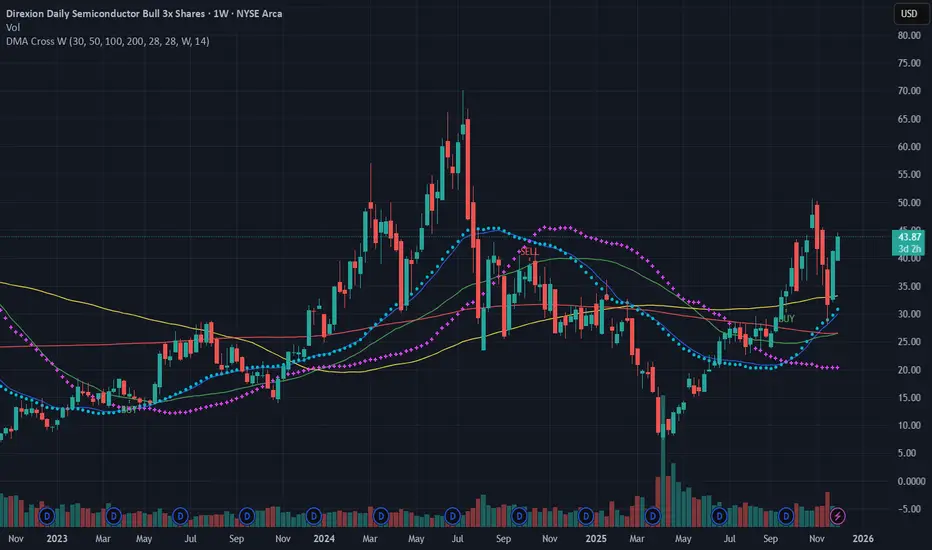
The Double Moving Average (DMA) Crossings indicator is a powerful tool designed to help traders identify potential buy and sell signals based on the crossover of two moving averages with different displacements. This indicator combines short and long Double Moving Averages (DMA) along with traditional Simple Moving Averages (SMA) to provide a comprehensive view of market trends and potential reversal points.
Key Features
DMA Short and Long: The indicator calculates two DMAs with the same period but different displacements, providing a more dynamic view of the market.
DMA Short: Plotted in fuchsia color with a circle style line for better visibility.
DMA Long: Plotted in aqua color with a cross style line to distinguish from the short DMA.
Simple Moving Averages:
SMA 30: Plotted in yellow, representing the short-term trend.
SMA 50: Plotted in blue, indicating the intermediate trend.
SMA 200: Plotted in green, showing the long-term trend.
Buy and Sell Signals:
Buy Signal: Generated when the short DMA crosses above the long DMA, indicated by a green upward arrow below the bar.
Sell Signal: Generated when the short DMA crosses below the long DMA, shown by a red downward arrow above the bar.
Usage
This indicator is suitable for traders looking for clear and actionable signals in the market. The combination of DMAs and SMAs allows traders to:
Identify potential entry and exit points based on DMA crossovers.
Observe short-term, intermediate, and long-term trends with SMAs.
Make informed trading decisions with the help of visual buy and sell signals.
How to Interpret
Buy Signal: A green arrow below a bar indicates a potential buying opportunity. This occurs when the short DMA (fuchsia) crosses above the long DMA (aqua).
Sell Signal: A red arrow above a bar signals a potential selling point. This happens when the short DMA (fuchsia) crosses below the long DMA (aqua).
Trend Analysis: The SMAs provide additional context for trend direction:
SMA 30 (yellow) shows the short-term trend.
SMA 50 (blue) reflects the intermediate trend.
SMA 200 (green) represents the long-term trend.
When SMA 30 crosses over the SMA 50 it is bullish and When it crosses below it is bearish trend
Conclusion
The Double Moving Average Crossings indicator is a versatile tool for traders seeking to enhance their market analysis with reliable trend and crossover signals. By combining DMAs and SMAs, this indicator offers a comprehensive view of market dynamics, making it easier to identify profitable trading opportunities.
릴리즈 노트
Update: Swapped the DMA Short and DMA Long Colors릴리즈 노트
SMA DMA Crossing SignalA powerful hybrid trend-and-momentum indicator combining Simple Moving Averages (SMA) with a Double Moving Average (DMA) crossover system.
This tool helps traders visualize market structure, trend strength, and momentum shifts all in one clean overlay — perfect for swing trading, stage analysis, and early trend detection.
🔍 What This Indicator Does
1. Trend Structure with SMAs (30, 50, 200)
The indicator plots:
SMA-30 — short-term trend
SMA-50 — medium-term confirmation
SMA-200 — long-term primary trend
These SMAs make it easy to identify:
Stage 1 — Consolidation
Stage 2 — Breakout & Uptrend
Stage 3 — Distribution / Topping
Stage 4 — Breakdown & Downtrend
Golden Cross & Death Cross dynamics
Trend slope & strength
2. DMA Momentum Engine (Fast vs Higher-Timeframe Slow DMA)
The heart of this indicator is the customizable Double Moving Average system:
Fast DMA: reacts quickly on the current timeframe
Slow DMA: derived from a user-selectable higher timeframe (default: Daily)
You may also shift the slow DMA for smoother trend confirmation.
This dual-DMA setup delivers:
✔ Faster signals than standard MA crossovers
✔ Fewer whipsaws
✔ Momentum confirmation from a higher timeframe
✔ Reliable trend continuation & reversal identification
3. Automatic BUY / SELL Signals
Buy and Sell signals trigger when:
📈 BUY → Fast DMA crosses above Slow DMA
📉 SELL → Fast DMA crosses below Slow DMA
Arrows are plotted directly on the chart:
BUY arrows appear below bars
SELL arrows appear above bars
Simple, visually clean, and ideal for signal scanning.
4. Built-in Alerts (Perfect for Automation)
Use TradingView’s alerts for:
SMA DMA Crossing Signal – BUY
SMA DMA Crossing Signal – SELL
Great for:
Live trading
Discord/Telegram alerts
Bot integrations
Swing/position trade monitoring
🎯 Who Should Use This Indicator
This indicator is built for traders who want trend clarity + early entries:
Swing traders
Trend followers
Momentum & breakout traders
ETF traders (SOXL, TQQQ, SPXL, etc.)
Crypto & FX traders
Stage Analysis users
🧠 Why It Works
Most indicators show either:
Trend structure (SMA)
or
Momentum shift (EMA/MA crossovers)
This indicator combines both, letting you see:
Where the trend is going (SMAs)
When momentum flips (DMA crossovers)
The result:
Fewer false entries and clearer trend continuation signals.
⚠️ Disclaimer
This script is for educational use.
Always pair signals with risk management and independent analysis.
릴리즈 노트
Updated SMAs오픈 소스 스크립트
트레이딩뷰의 진정한 정신에 따라, 이 스크립트의 작성자는 이를 오픈소스로 공개하여 트레이더들이 기능을 검토하고 검증할 수 있도록 했습니다. 작성자에게 찬사를 보냅니다! 이 코드는 무료로 사용할 수 있지만, 코드를 재게시하는 경우 하우스 룰이 적용된다는 점을 기억하세요.
면책사항
해당 정보와 게시물은 금융, 투자, 트레이딩 또는 기타 유형의 조언이나 권장 사항으로 간주되지 않으며, 트레이딩뷰에서 제공하거나 보증하는 것이 아닙니다. 자세한 내용은 이용 약관을 참조하세요.
오픈 소스 스크립트
트레이딩뷰의 진정한 정신에 따라, 이 스크립트의 작성자는 이를 오픈소스로 공개하여 트레이더들이 기능을 검토하고 검증할 수 있도록 했습니다. 작성자에게 찬사를 보냅니다! 이 코드는 무료로 사용할 수 있지만, 코드를 재게시하는 경우 하우스 룰이 적용된다는 점을 기억하세요.
면책사항
해당 정보와 게시물은 금융, 투자, 트레이딩 또는 기타 유형의 조언이나 권장 사항으로 간주되지 않으며, 트레이딩뷰에서 제공하거나 보증하는 것이 아닙니다. 자세한 내용은 이용 약관을 참조하세요.