PROTECTED SOURCE SCRIPT
KIMATIX LITE Absorption
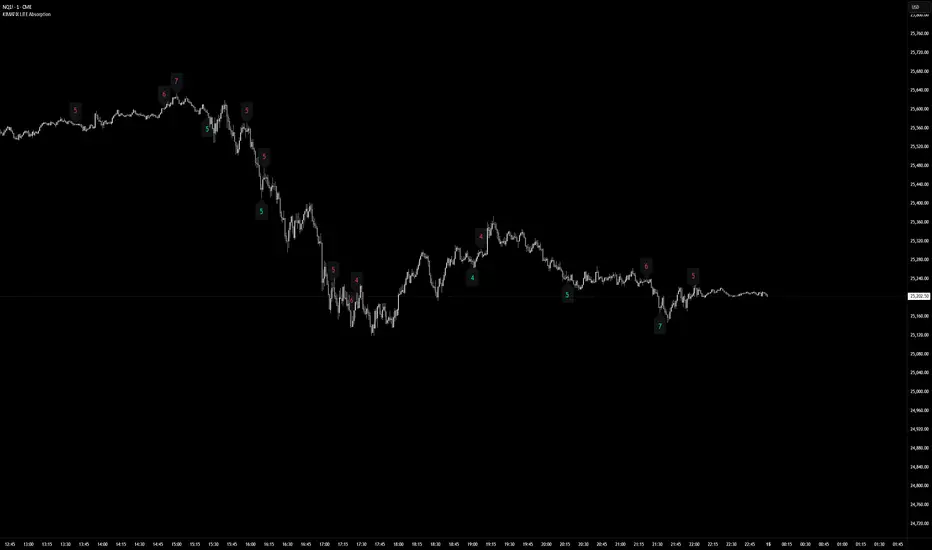
This indicator highlights absorption intensity directly on the chart using numeric sigma values only.
It is a deliberately reduced, signal-agnostic visualization designed to expose where significant absorption occurs, without adding levels, lines, or trade logic.
What you see
Numeric sigma values on candles
Each number represents the strength of absorption measured in standard deviations (σ).
Color-coded context
Green numbers below price → sell-side absorption
Red numbers above price → buy-side absorption
Only values that exceed the Minimum Sigma threshold are displayed.
No lines, zones, triangles, or alerts are shown — only the raw absorption magnitude.
How it works (LITE Version)
Absorption is derived from volume relative to candle structure
Values are normalized and filtered using:
A fixed statistical lookback
Wick dominance rules to avoid noise
Only statistically significant events (σ ≥ threshold) are visualized
All other calculations run silently in the background.
Intended use
This Lite version is meant to:
Identify areas of aggressive participation or defense
Spot potential absorption during trends or ranges
Provide context for liquidity, exhaustion, or hidden interest
It is not a trading system and does not generate entries or exits.
Use it as a contextual layer alongside your own execution logic.
The full version is distributed separately.
More information can be found here:
whop.com/kimatixtrading
보호된 스크립트입니다
이 스크립트는 비공개 소스로 게시됩니다. 하지만 이를 자유롭게 제한 없이 사용할 수 있습니다 – 자세한 내용은 여기에서 확인하세요.
KIMATIX Trading
면책사항
해당 정보와 게시물은 금융, 투자, 트레이딩 또는 기타 유형의 조언이나 권장 사항으로 간주되지 않으며, 트레이딩뷰에서 제공하거나 보증하는 것이 아닙니다. 자세한 내용은 이용 약관을 참조하세요.
보호된 스크립트입니다
이 스크립트는 비공개 소스로 게시됩니다. 하지만 이를 자유롭게 제한 없이 사용할 수 있습니다 – 자세한 내용은 여기에서 확인하세요.
KIMATIX Trading
면책사항
해당 정보와 게시물은 금융, 투자, 트레이딩 또는 기타 유형의 조언이나 권장 사항으로 간주되지 않으며, 트레이딩뷰에서 제공하거나 보증하는 것이 아닙니다. 자세한 내용은 이용 약관을 참조하세요.