PROTECTED SOURCE SCRIPT
DVWAP Overlay Indicator
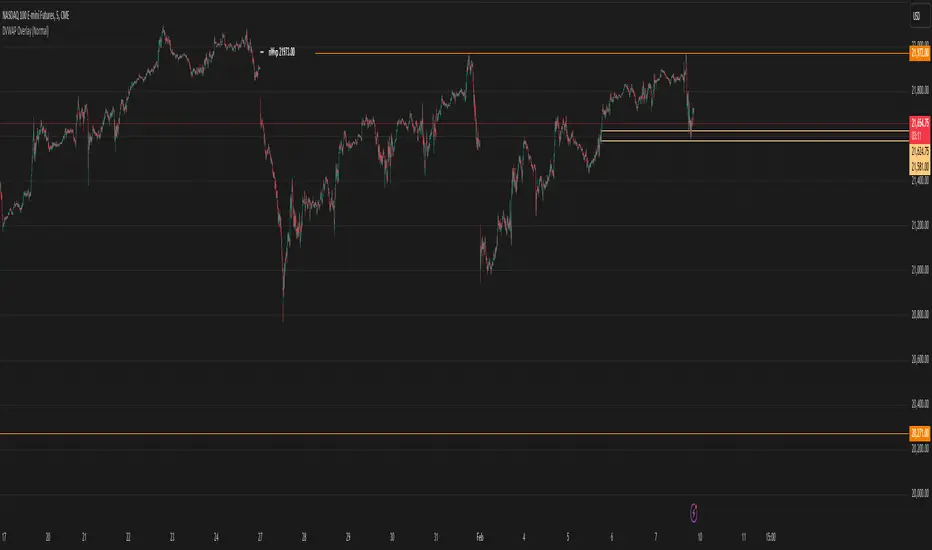
The DVWAP Overlay is a custom TradingView indicator designed to track Volume-Weighted Average Price (VWAP) levels over different time periods and visualize untapped VWAP levels on the price chart. It also includes historical VWAP tracking, which helps traders identify key support and resistance levels.
Key Features & Functionality
1. User Inputs & Settings
Text Size Selection: Allows users to choose the text size for labels (Tiny, Small, Normal, Large).
VWAP Display Options:
Option to show/hide VWAP levels.
Option to display Naked VWAP levels, meaning VWAP levels that have not been touched by price yet.
Color Customization: Users can configure colors for VWAP lines and labels.
2. VWAP Calculation & Plotting
Daily VWAP Calculation: The script calculates the VWAP for each daily session, adjusting at the start of a new day.
Standard Deviation Bands: The script also calculates the VWAP deviation (similar to Bollinger Bands).
Plotting VWAP: A line is drawn on the chart to visualize VWAP levels for the current and past sessions.
3. Untapped VWAP Level Tracking
The indicator keeps track of VWAP levels that have not yet been touched by price.
If price crosses a previous VWAP level, it is removed from the chart.
These untouched levels are highlighted and labeled on the chart.
4. Historical VWAP Levels
The indicator stores and plots previous VWAP levels, helping traders identify key historical price zones.
Two types of historical VWAPs are displayed:
Previous day VWAP (pdVWAP)
Historical Naked VWAP levels (nVWAP)
How Traders Can Use This Indicator
✅ Support & Resistance Identification: Helps traders find key VWAP levels that can act as support/resistance.
✅ Breakout & Rejection Trades: If price approaches an untouched VWAP, it could indicate a potential reaction.
✅ Institutional Order Flow Tracking: VWAP is often used by institutions for volume-based trade execution.
보호된 스크립트입니다
이 스크립트는 비공개 소스로 게시됩니다. 하지만 이를 자유롭게 제한 없이 사용할 수 있습니다 – 자세한 내용은 여기에서 확인하세요.
면책사항
해당 정보와 게시물은 금융, 투자, 트레이딩 또는 기타 유형의 조언이나 권장 사항으로 간주되지 않으며, 트레이딩뷰에서 제공하거나 보증하는 것이 아닙니다. 자세한 내용은 이용 약관을 참조하세요.
면책사항
해당 정보와 게시물은 금융, 투자, 트레이딩 또는 기타 유형의 조언이나 권장 사항으로 간주되지 않으며, 트레이딩뷰에서 제공하거나 보증하는 것이 아닙니다. 자세한 내용은 이용 약관을 참조하세요.