OPEN-SOURCE SCRIPT
X EMA EQ
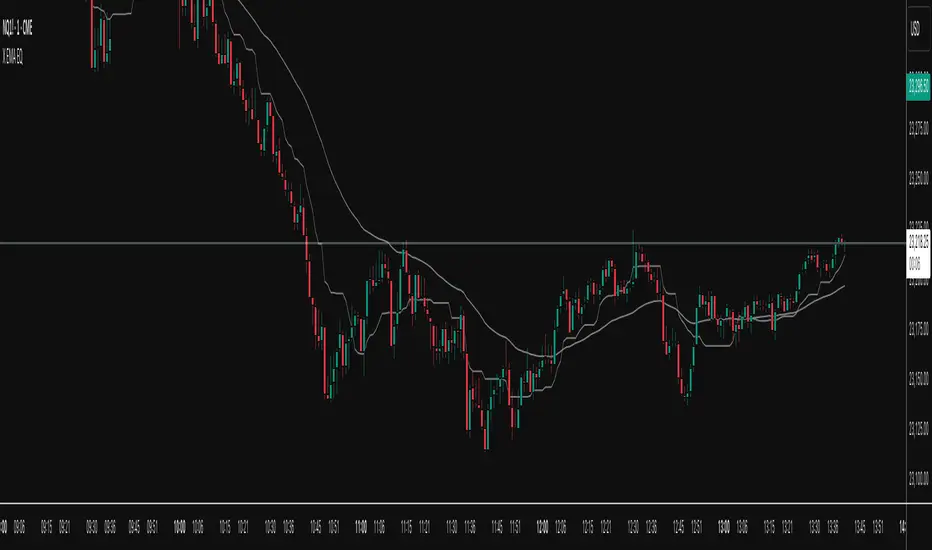
The X EMA EQ is a versatile technical analysis tool designed to overlay price action with customizable Exponential Moving Averages (EMAs) and real-time equilibrium levels. Ideal for intraday traders, it blends trend-following and mean-reversion concepts to highlight both directional bias and potential value zones.
🔹 Key Features:
1. Dual EMA Visualization
Plot up to two user-defined EMAs (default: 20 and 50 periods).
Independently toggle and style each EMA to suit your strategy.
Helps track short- and mid-term trend dynamics with clarity.
2. Running Equilibrium Bands
Displays a real-time dynamic price range based on the highest high and lowest low over a user-defined rolling window (default: 15 minutes).
Includes upper/lower quartile lines and a central midpoint, giving structure to intraday price movement.
Useful for identifying compression, breakouts, and fair value zones.
3. Linear Regression Overlay (Optional)
Apply a smoothed linear regression curve across the same time window.
Highlights directional momentum and price mean trajectory.
Valuable for assessing slope bias and trend strength over the equilibrium period.
4. Intraday Timeframe Optimization
Designed specifically for intraday charts with minute-based resolutions (30 seconds to 60 minutes).
Auto-adjusts logic based on the current chart’s timeframe.
5. Clean Visual Design
Minimalist and translucent color schemes ensure readability without clutter.
All components are independently toggleable for full customization.
⚙️ Settings Overview:
EMA Settings: Enable/disable each EMA, set lengths and colors.
Time & Price Settings: Define the running equilibrium period (in minutes), control visibility of bands and regression line, and adjust styling.
X EMA EQ offers a compact yet powerful visual framework for traders seeking to align with short-term trend structure while keeping an eye on evolving price balance zones.
오픈 소스 스크립트
트레이딩뷰의 진정한 정신에 따라, 이 스크립트의 작성자는 이를 오픈소스로 공개하여 트레이더들이 기능을 검토하고 검증할 수 있도록 했습니다. 작성자에게 찬사를 보냅니다! 이 코드는 무료로 사용할 수 있지만, 코드를 재게시하는 경우 하우스 룰이 적용된다는 점을 기억하세요.
면책사항
해당 정보와 게시물은 금융, 투자, 트레이딩 또는 기타 유형의 조언이나 권장 사항으로 간주되지 않으며, 트레이딩뷰에서 제공하거나 보증하는 것이 아닙니다. 자세한 내용은 이용 약관을 참조하세요.
오픈 소스 스크립트
트레이딩뷰의 진정한 정신에 따라, 이 스크립트의 작성자는 이를 오픈소스로 공개하여 트레이더들이 기능을 검토하고 검증할 수 있도록 했습니다. 작성자에게 찬사를 보냅니다! 이 코드는 무료로 사용할 수 있지만, 코드를 재게시하는 경우 하우스 룰이 적용된다는 점을 기억하세요.
면책사항
해당 정보와 게시물은 금융, 투자, 트레이딩 또는 기타 유형의 조언이나 권장 사항으로 간주되지 않으며, 트레이딩뷰에서 제공하거나 보증하는 것이 아닙니다. 자세한 내용은 이용 약관을 참조하세요.