OPEN-SOURCE SCRIPT
SSRO Z-Score
SSRO Z-Score Indicator — Description
What it does:
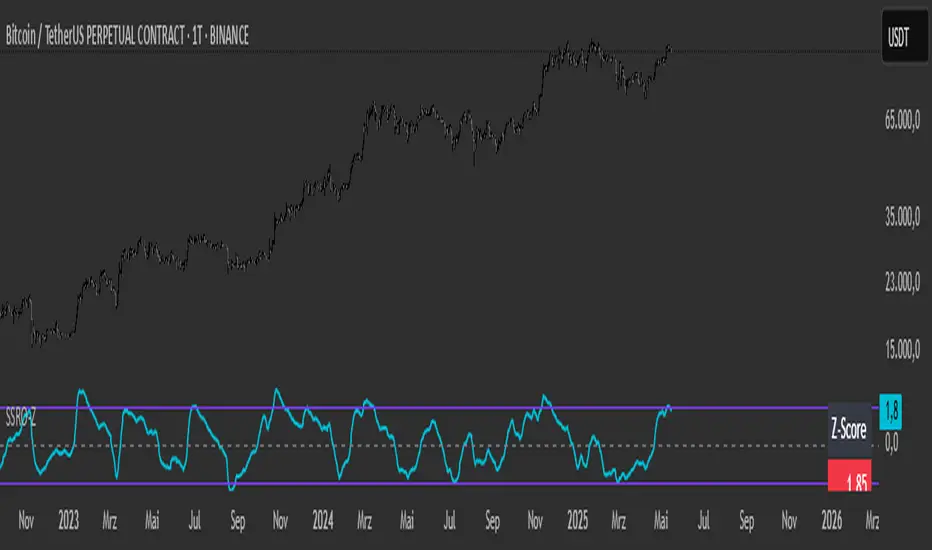
This indicator measures the Stablecoin Supply Ratio (SSR) relative to Bitcoin’s market cap and calculates a normalized Z-Score of this ratio to help identify potential market tops and bottoms in the crypto market.
How it works:
The Stablecoin Supply Ratio (SSR) is calculated by dividing Bitcoin’s market capitalization by the combined market capitalization of major stablecoins (USDT, USDC, TUSD, DAI, FRAX).
The SSR is then smoothed over a user-defined lookback period to reduce noise.
A Z-Score is computed by normalizing the SSR over a specified moving window, which shows how far the current SSR deviates from its historical average in terms of standard deviations.
This Z-Score is further smoothed using an exponential moving average (EMA) to filter short-term volatility.
How to read the Z-Score:
Z-Score = 0: SSR is at its historical average.
Z-Score > 0: SSR is above average, indicating Bitcoin’s market cap is relatively high compared to stablecoin supply, potentially signaling bullish market conditions.
Z-Score < 0: SSR is below average, indicating stablecoin supply is high relative to Bitcoin’s market cap, possibly signaling bearish pressure or increased liquidity waiting to enter the market.
Upper and Lower Bands: These user-defined levels (e.g., +2 and -2) represent thresholds for extreme conditions. Values above the upper band may indicate overbought or overheated market conditions, while values below the lower band may indicate oversold or undervalued conditions.
Additional Features:
A dynamic table displays a linear scaled Z-Score alongside the main plot, clamped between -2 and +2 relative to the upper and lower bands for intuitive interpretation.
Usage Tips:
Combine the SSRO Z-Score with other technical indicators or volume analysis for more reliable signals.
Look for divergence between price and Z-Score extremes as potential reversal signals.
What it does:
This indicator measures the Stablecoin Supply Ratio (SSR) relative to Bitcoin’s market cap and calculates a normalized Z-Score of this ratio to help identify potential market tops and bottoms in the crypto market.
How it works:
The Stablecoin Supply Ratio (SSR) is calculated by dividing Bitcoin’s market capitalization by the combined market capitalization of major stablecoins (USDT, USDC, TUSD, DAI, FRAX).
The SSR is then smoothed over a user-defined lookback period to reduce noise.
A Z-Score is computed by normalizing the SSR over a specified moving window, which shows how far the current SSR deviates from its historical average in terms of standard deviations.
This Z-Score is further smoothed using an exponential moving average (EMA) to filter short-term volatility.
How to read the Z-Score:
Z-Score = 0: SSR is at its historical average.
Z-Score > 0: SSR is above average, indicating Bitcoin’s market cap is relatively high compared to stablecoin supply, potentially signaling bullish market conditions.
Z-Score < 0: SSR is below average, indicating stablecoin supply is high relative to Bitcoin’s market cap, possibly signaling bearish pressure or increased liquidity waiting to enter the market.
Upper and Lower Bands: These user-defined levels (e.g., +2 and -2) represent thresholds for extreme conditions. Values above the upper band may indicate overbought or overheated market conditions, while values below the lower band may indicate oversold or undervalued conditions.
Additional Features:
A dynamic table displays a linear scaled Z-Score alongside the main plot, clamped between -2 and +2 relative to the upper and lower bands for intuitive interpretation.
Usage Tips:
Combine the SSRO Z-Score with other technical indicators or volume analysis for more reliable signals.
Look for divergence between price and Z-Score extremes as potential reversal signals.
오픈 소스 스크립트
트레이딩뷰의 진정한 정신에 따라, 이 스크립트의 작성자는 이를 오픈소스로 공개하여 트레이더들이 기능을 검토하고 검증할 수 있도록 했습니다. 작성자에게 찬사를 보냅니다! 이 코드는 무료로 사용할 수 있지만, 코드를 재게시하는 경우 하우스 룰이 적용된다는 점을 기억하세요.
면책사항
해당 정보와 게시물은 금융, 투자, 트레이딩 또는 기타 유형의 조언이나 권장 사항으로 간주되지 않으며, 트레이딩뷰에서 제공하거나 보증하는 것이 아닙니다. 자세한 내용은 이용 약관을 참조하세요.
오픈 소스 스크립트
트레이딩뷰의 진정한 정신에 따라, 이 스크립트의 작성자는 이를 오픈소스로 공개하여 트레이더들이 기능을 검토하고 검증할 수 있도록 했습니다. 작성자에게 찬사를 보냅니다! 이 코드는 무료로 사용할 수 있지만, 코드를 재게시하는 경우 하우스 룰이 적용된다는 점을 기억하세요.
면책사항
해당 정보와 게시물은 금융, 투자, 트레이딩 또는 기타 유형의 조언이나 권장 사항으로 간주되지 않으며, 트레이딩뷰에서 제공하거나 보증하는 것이 아닙니다. 자세한 내용은 이용 약관을 참조하세요.