OPEN-SOURCE SCRIPT
Mayer Multiple (with muti-color histogram)
This is inspired by unbound's work on the Mayer Multiple script.
This script is designed to work with the daily chart.

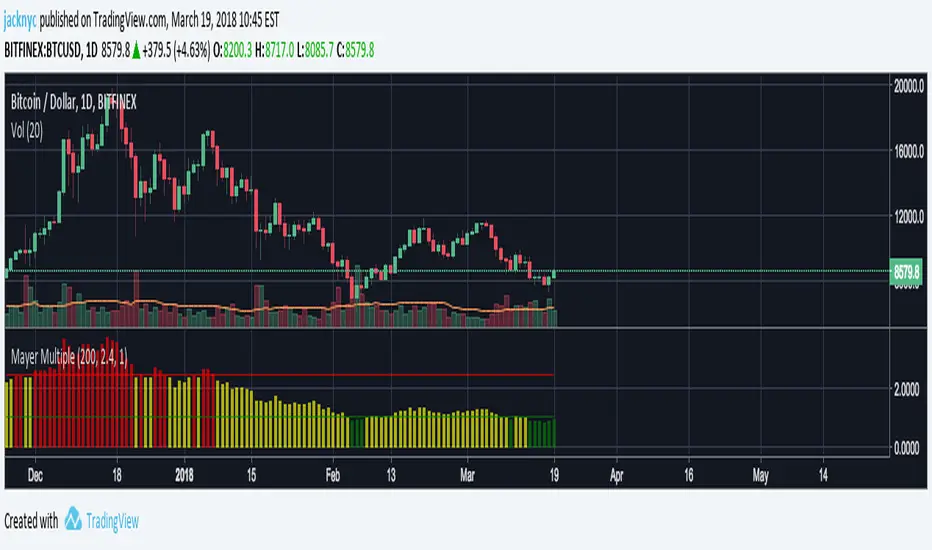
I created this script so you can see the daily Mayer Multiple by just hovering over the bar in the histogram. I modified the color of the histogram bar to indicate the following:
Red = Over 2.4x Mayer Multiple, overvalued
Yellow = Between 1x to 2.4x Mayer Mutiple, fairly valued
Green = Under 1x Mayer Multiple, undervalued
This is my first script so let me know if there are any issues or suggestions on how to change it.
This script is designed to work with the daily chart.
I created this script so you can see the daily Mayer Multiple by just hovering over the bar in the histogram. I modified the color of the histogram bar to indicate the following:
Red = Over 2.4x Mayer Multiple, overvalued
Yellow = Between 1x to 2.4x Mayer Mutiple, fairly valued
Green = Under 1x Mayer Multiple, undervalued
This is my first script so let me know if there are any issues or suggestions on how to change it.
오픈 소스 스크립트
트레이딩뷰의 진정한 정신에 따라, 이 스크립트의 작성자는 이를 오픈소스로 공개하여 트레이더들이 기능을 검토하고 검증할 수 있도록 했습니다. 작성자에게 찬사를 보냅니다! 이 코드는 무료로 사용할 수 있지만, 코드를 재게시하는 경우 하우스 룰이 적용된다는 점을 기억하세요.
면책사항
해당 정보와 게시물은 금융, 투자, 트레이딩 또는 기타 유형의 조언이나 권장 사항으로 간주되지 않으며, 트레이딩뷰에서 제공하거나 보증하는 것이 아닙니다. 자세한 내용은 이용 약관을 참조하세요.
오픈 소스 스크립트
트레이딩뷰의 진정한 정신에 따라, 이 스크립트의 작성자는 이를 오픈소스로 공개하여 트레이더들이 기능을 검토하고 검증할 수 있도록 했습니다. 작성자에게 찬사를 보냅니다! 이 코드는 무료로 사용할 수 있지만, 코드를 재게시하는 경우 하우스 룰이 적용된다는 점을 기억하세요.
면책사항
해당 정보와 게시물은 금융, 투자, 트레이딩 또는 기타 유형의 조언이나 권장 사항으로 간주되지 않으며, 트레이딩뷰에서 제공하거나 보증하는 것이 아닙니다. 자세한 내용은 이용 약관을 참조하세요.