OPEN-SOURCE SCRIPT
Custom Price Levels and Averages
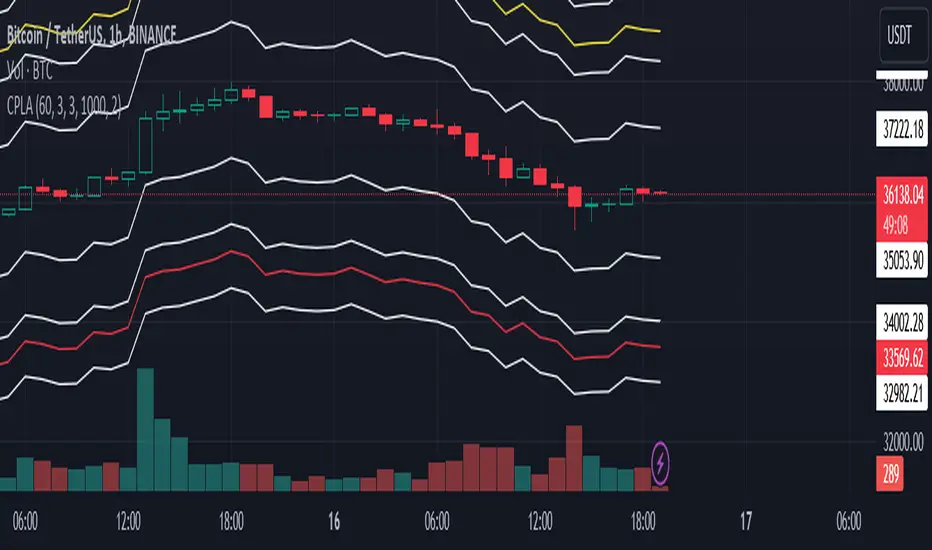
The "Custom Price Levels and Averages" indicator is a versatile tool designed for TradingView. It dynamically calculates and displays key price levels based on user-defined parameters such as distance percentages and position size. The indicator plots three ascending and descending price levels (A, B, C, X, Y, Z) around the last candle close on a specified timeframe. Additionally, it provides the average price for both upward and downward movements, considering the user's specified position size and increase factor. Traders can easily customize the visual appearance by adjusting colors for each plotted line. This indicator assists in identifying potential support and resistance levels and understanding the average price movements within a specified trading context.
Avoid SL hunting by acumulating your position with scaled orders.
Input Parameters:
inputTimeframe: Allows the user to select a specific timeframe (default: "D" for daily).
distancePercentageUp: Determines the percentage increase for ascending price levels (default: 1.5%).
distancePercentageDown: Determines the percentage decrease for descending price levels (default: 1.5%).
position: Specifies the position size in USD for calculating average prices (default: $100).
increaseFactor: Adjusts the increase in position size for each subsequent level (default: 1.5).
calcAvgPrice Function:
Parameters:
priceA, priceB, priceC: Ascending price levels.
priceX, priceY, priceZ: Descending price levels.
position: User-defined position size.
increaseFactor: User-defined increase factor.
Calculation:
Calculates the weighted average price for ascending (priceA, priceB, priceC) and descending (priceX, priceY, priceZ) levels.
Utilizes the specified position size and increase factor to determine the weighted average.
Plotting:
Price Calculations:
priceA, priceB, priceC: Derived by applying percentage increases to the last candle's close.
priceX, priceY, priceZ: Derived by applying percentage decreases to the last candle's close.
avgPriceUp, avgPriceDown: Computed using the calcAvgPrice function for ascending and descending levels, respectively.
Plotting Colors:
User-customizable through input parameters (colorPriceA, colorPriceB, colorPriceC, colorAvgPriceUp, colorPriceX, colorPriceY, colorPriceZ, colorAvgPriceDown).
Styling:
All lines are plotted with minimal thickness (linewidth=1) for a clean visualization.
Overall, the indicator empowers traders to analyze potential support and resistance levels and understand average price movements based on their specified parameters. The flexibility of color customization adds a layer of personalization to suit individual preferences.
오픈 소스 스크립트
트레이딩뷰의 진정한 정신에 따라, 이 스크립트의 작성자는 이를 오픈소스로 공개하여 트레이더들이 기능을 검토하고 검증할 수 있도록 했습니다. 작성자에게 찬사를 보냅니다! 이 코드는 무료로 사용할 수 있지만, 코드를 재게시하는 경우 하우스 룰이 적용된다는 점을 기억하세요.
면책사항
해당 정보와 게시물은 금융, 투자, 트레이딩 또는 기타 유형의 조언이나 권장 사항으로 간주되지 않으며, 트레이딩뷰에서 제공하거나 보증하는 것이 아닙니다. 자세한 내용은 이용 약관을 참조하세요.
오픈 소스 스크립트
트레이딩뷰의 진정한 정신에 따라, 이 스크립트의 작성자는 이를 오픈소스로 공개하여 트레이더들이 기능을 검토하고 검증할 수 있도록 했습니다. 작성자에게 찬사를 보냅니다! 이 코드는 무료로 사용할 수 있지만, 코드를 재게시하는 경우 하우스 룰이 적용된다는 점을 기억하세요.
면책사항
해당 정보와 게시물은 금융, 투자, 트레이딩 또는 기타 유형의 조언이나 권장 사항으로 간주되지 않으며, 트레이딩뷰에서 제공하거나 보증하는 것이 아닙니다. 자세한 내용은 이용 약관을 참조하세요.