Hello!
BE SURE TO RUN THE SCRIPT WITH BAR REPLAY TO SEE WHAT IT DOES! I hope you like it!
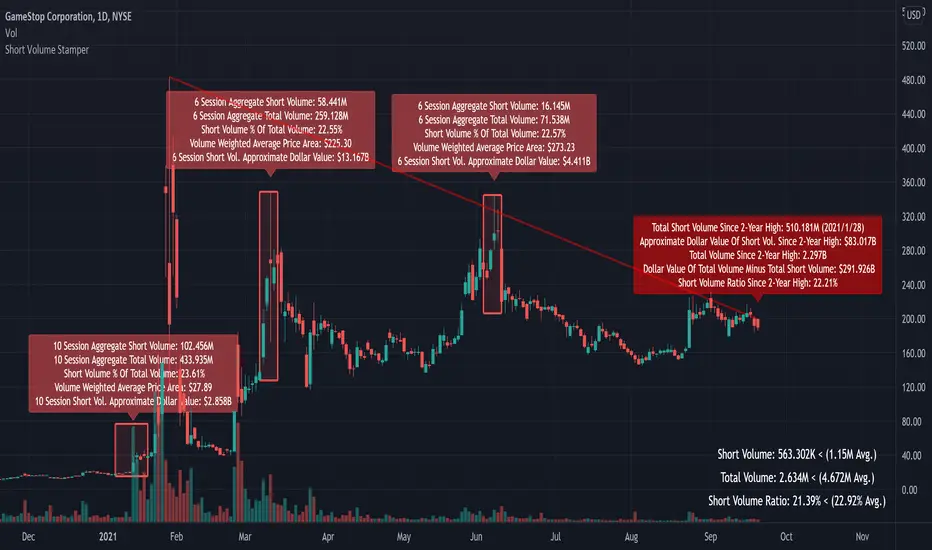
This script calculates the total short volume, total volume, and the short volume / total volume ratio since the 2-year high price. In addition, the approximate dollar value of all short volume since the 2-year high, and the approximate dollar value of all non-short sell volume since the 2-year high is calculated using VWAP. A red line (short interest ratio >= 20%) connects the 2-year high to current session’s high price; a green line (short interest ratio < 20%) connects the 2-year high to the current session’s high.
The script also “stamps” sessions in which a NEW 1-year high in SHORT volume is achieved, and when a PIVOT POINT high is achieved (highest high over 51 sessions). When a new high in short volume is achieved the script aggregates the total volume and short volume for the 5 sessions prior to the new high, the session of the new high, and the 4 sessions after the new high (10 sessions). Additional volume calculations are performed for the 10 session period!
When a pivot point high is achieved the script aggregates the total volume and short volume for the 3 sessions prior to the pivot high, the session of the pivot high, and the 2 sessions after the new high (6 sessions). Additional volume calculations are performed for the 6 session period!
Red labels, red boxes, and red lines indicate a short volume ratio greater than or equal to 20% over the corresponding period!
Green labels, green boxes, and green lines indicate a short volume ratio less than 20% over the corresponding period!
BE SURE TO RUN THE SCRIPT WITH BAR REPLAY TO SEE WHAT IT DOES! I hope you like it!
This script calculates the total short volume, total volume, and the short volume / total volume ratio since the 2-year high price. In addition, the approximate dollar value of all short volume since the 2-year high, and the approximate dollar value of all non-short sell volume since the 2-year high is calculated using VWAP. A red line (short interest ratio >= 20%) connects the 2-year high to current session’s high price; a green line (short interest ratio < 20%) connects the 2-year high to the current session’s high.
The script also “stamps” sessions in which a NEW 1-year high in SHORT volume is achieved, and when a PIVOT POINT high is achieved (highest high over 51 sessions). When a new high in short volume is achieved the script aggregates the total volume and short volume for the 5 sessions prior to the new high, the session of the new high, and the 4 sessions after the new high (10 sessions). Additional volume calculations are performed for the 10 session period!
When a pivot point high is achieved the script aggregates the total volume and short volume for the 3 sessions prior to the pivot high, the session of the pivot high, and the 2 sessions after the new high (6 sessions). Additional volume calculations are performed for the 6 session period!
Red labels, red boxes, and red lines indicate a short volume ratio greater than or equal to 20% over the corresponding period!
Green labels, green boxes, and green lines indicate a short volume ratio less than 20% over the corresponding period!
릴리즈 노트
Changed the tracking label y-axis plot. The tracking label will trail price a bit tighter!릴리즈 노트
Added name릴리즈 노트
Memory calculation compliant오픈 소스 스크립트
트레이딩뷰의 진정한 정신에 따라, 이 스크립트의 작성자는 이를 오픈소스로 공개하여 트레이더들이 기능을 검토하고 검증할 수 있도록 했습니다. 작성자에게 찬사를 보냅니다! 이 코드는 무료로 사용할 수 있지만, 코드를 재게시하는 경우 하우스 룰이 적용된다는 점을 기억하세요.
•Access to Next-Gen Optimization Tools: tradingiq.io
•Discord Server: discord.gg/aKWPuM4HPy
•Discord Server: discord.gg/aKWPuM4HPy
면책사항
해당 정보와 게시물은 금융, 투자, 트레이딩 또는 기타 유형의 조언이나 권장 사항으로 간주되지 않으며, 트레이딩뷰에서 제공하거나 보증하는 것이 아닙니다. 자세한 내용은 이용 약관을 참조하세요.
오픈 소스 스크립트
트레이딩뷰의 진정한 정신에 따라, 이 스크립트의 작성자는 이를 오픈소스로 공개하여 트레이더들이 기능을 검토하고 검증할 수 있도록 했습니다. 작성자에게 찬사를 보냅니다! 이 코드는 무료로 사용할 수 있지만, 코드를 재게시하는 경우 하우스 룰이 적용된다는 점을 기억하세요.
•Access to Next-Gen Optimization Tools: tradingiq.io
•Discord Server: discord.gg/aKWPuM4HPy
•Discord Server: discord.gg/aKWPuM4HPy
면책사항
해당 정보와 게시물은 금융, 투자, 트레이딩 또는 기타 유형의 조언이나 권장 사항으로 간주되지 않으며, 트레이딩뷰에서 제공하거나 보증하는 것이 아닙니다. 자세한 내용은 이용 약관을 참조하세요.